 Sick buying high & selling low? Fed up of the fees you pay? Tired researching investments? End your financial pain now. You have the opportunity to
 Investors want to know the answer to ‘Will the Stock Market Go Up in 2022?’ after stocks have quickly lost 7% this year. This decline has taken a bite out of the 29% gain stocks enjoyed in 2021. Investors worry about the Federal Reserve aggressively tightening interest rate policy in response to high inflation. Will the stock market go up in 2022?
Investors could not have had a better year in the market than 2021 in many ways.
The S&P 500 advanced nearly 29%, ending the year within 1% of its record daily close.
The benchmark index recorded 70 new highs through 2021, the second-most in a calendar year ever.
These gains came with little volatility, with the year’s highest drawdown being a mere 5%.
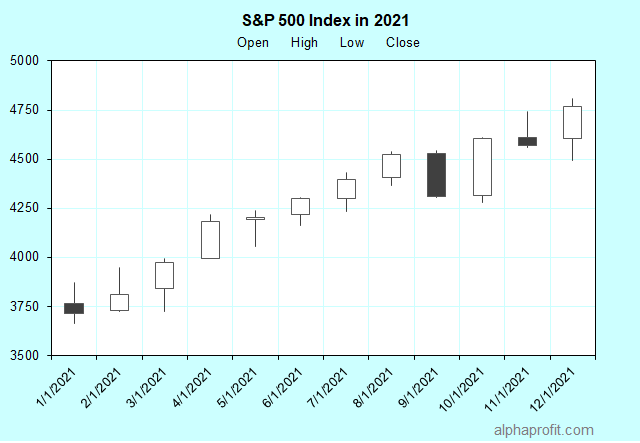
Stocks lost ground in January, September, and November of 2021. They made significant gains in the first, second, and fourth quarters, helping the S&P 500 close the year within 1% of its record daily close. Register now to receive AlphaProfit investment ideas, tips, and analyses in your inbox.
The Federal Reserve continued to support the economy through 2021 with near-zero interest rates and bond purchases implemented in response to the pandemic in 2020.
The economy showed robust growth in the first-half of 2021. U. S. gross domestic product (GDP) expanded at annualized rates of 6.3% and 6.7% in the first and second quarter, respectively.
The emergence of the delta coronavirus variant pressured GDP growth in the third quarter to 2.3% before rebounding to grow at a 6.9% annualized rate in the fourth.
Robust year-over-year earnings growth supported the advance in stock prices in 2021.
According to FactSet, S&P 500 members are on track to grow per-share earnings (EPS) by 45.5% in 2021. They grew EPS by 47%, 87%, and 24%, respectively, in the first three quarters of 2021. Analysts currently expect S&P 500 members to grow EPS by 24.3% in the fourth quarter.
Key factors likely to influence stock market performance in 2022 include inflation & interest rates, earnings growth, valuation, political events, and COVID developments.
Will the Stock Market Go Up in 2022? – Inflation and Interest Rate Impact
Year-over-year increases in inflation measures generally worsened through 2021 due to supply chain disruptions and labor shortages.
On January 28, 2022, the U. S. Bureau of Economic Analysis reported the core personal consumption expenditures index (core PCE), the Federal Reserve’s preferred inflation measure, rose 4.9% in 2021, the highest 12-month increase since September 1983.
After holding its first interest rate policy meeting in 2022 on January 25-26, the Federal Reserve warned inflation remains above its long-run goal and supply problems are larger & more long-lasting than previously thought.
Chairman Powell said there is significant room to raise interest rates without hurting the labor market, virtually assuring an interest rate hike after the Fed meets next in March.
The Fed also indicated that it would begin shrinking its $9 trillion balance sheet after implementing its first interest rate increase in 2022.
Curtailing inflation without halting an economic expansion requires a deft touch. The Federal Reserve needs to follow a balancing act in 2022.
With growth and inflation already set to slow this year, investors fear the central bank’s aggressive stance on inflation could tip the economy into another recession. These worries have caused stocks to sell off this month
Will the Stock Market Go Up in 2022? – Earnings Growth Impact
Stock prices are likely to face headwinds in 2022 from earnings growth and valuation perspectives.
According to FactSet, analysts expect S&P 500 members to grow their earnings by 9.5% in 2022, faster than 7.7% averaged from 2012 through 2021.
Yet, this 2022 earnings growth forecast is a significant slowdown from the 45.5% growth in earnings expected in 2021.
History shows stocks have trouble making headway when earnings growth slows.
Learn more: Which sectors are likely to fare well this year?
Will the Stock Market Go Up in 2022? – Valuation Impact
The S&P 500 has gained at a 14.3% annualized rate, excluding dividends from 2012 to 2021. Meanwhile, earnings have grown at a 7.7% annualized rate.
Gains in stock prices have exceeded earnings growth due to an expansion in the price-to-earnings (P/E) ratio valuation metric.
The Federal Reserve’s near-zero interest rate policy has supported the increase in the P/E ratio.
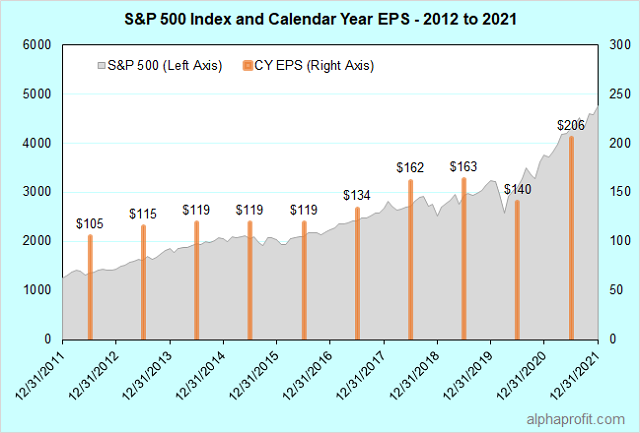
Excluding dividends, the S&P 500 returned 14.3% annualized since 2012, while aggregate EPS for the S&P 500 members has grown 7.7% annualized. Register now to receive AlphaProfit investment ideas, tips, and analyses in your inbox.
The members of the S&P 500 now trade at 19.2-times analysts’ 12-month earnings forecast, compared to this metric’s 10-year average of 16.7.
Interest rates are poised to rise in 2022 since the Fed’s focus is on inflation.
Rising interest rates cause the P/E ratio to decline since earnings in future years become less worth when discounted at higher interest rates.
As such, some compression in the P/E ratio is likely as long as the Fed is in an inflation-fighting mode.
Learn more: What are the best growth stocks to buy now in the top sectors?
Will the Stock Market Go Up in 2022? – Impact of Political Events
The tension in Ukraine has attracted worldwide attention since the start of the year. Concerns of Russia planning to invade Ukraine are up. U. S. troops are on alert due to the buildup of Russian forces along the Ukraine border.
Likewise, tensions between the U. S. & China are up over the future of Taiwan.
The year also includes the U. S. mid-term elections in November. If Republicans gain control of either the U. S. House or Senate, a split Congress can be good news for investors.
Historically, stocks have returned the most under Democratic presidents kept in check by a split or Republican-controlled Congress.
Will the Stock Market Go Up in 2022? – COVID Impact
The surge in COVID cases in late 2021 from the omicron coronavirus variant and the emergence of the omicron subvariant BA.2 in 2022 raises uncertainty. The new variants can potentially disrupt supply chains further and exacerbate inflation.
The World Health Organization warns the next coronavirus variant will be more transmissible. The major unknown is whether or not future variants will be more or less severe.
The transmissibility of the new virus variants and the severity of the illness they cause will impact how the economy performs in 2022. The economy can fare well if new virus variants are more transmissible and milder.
While this would be great for humanity, the implications for investors may not be favorable as this would remove the reason for the Federal Reserve to limit interest rates increases.
So, what does all this mean? Will the stock market go up in 2022?
Will the Stock Market Go Up in 2022? – The Bottom Line
We look at two scenarios to assess the range of reasonable outcomes.
On January 28, the S&P 500 closed at 4,431.85, implying a trailing P/E ratio of 21.6 based on analysts’ 2021 EPS estimate of $205.51.
The trailing P/E ratio has ranged between 13.0 and 35.0 from 2012 through 2021, averaging 23.0 over these 10 years.
The S&P 500 would close 2022 at 5,151 if S&P 500 members earn $223.94 a share in 2022, as analysts currently expect, and the trailing P/E ratio returns to its 23.0 average. This close would imply a 2022 year-end forward P/E ratio of 20.9, assuming analysts’ 2023 S&P 500 EPS forecast stays at $246.52.
In this scenario, the S&P 500 would rise 16% from its January 28 close to gain 8% in 2022.
The above scenario can materialize if the Federal Reserve does not drastically tighten interest rate policy, helping the trailing P/E ratio return to its long-term average and S&P 500 company aggregate EPS in 2022 to meet or exceed current expectations.
How low can stocks reasonably drop if inflation does not moderate and the Federal Reserve raises interest rates multiple times in 2022?
In this case, reasonable assumptions include weaker economic growth, lower P/E ratio, and lower 2023 S&P 500 EPS forecast.
Assuming no growth in earnings between 2022 and 2023, S&P 500 companies would earn $223.94 a share in 2023, the same as in 2022.
If the forward P/E ratio returns to its 5-year average of 18.5, the S&P 500 will end 2022 at 4,143. The S&P 500 will end 2022 6.5% below its January 28 close, declining 13% for the year.
If the forward P/E ratio returns to its 10-year average of 16.7, the S&P 500 will end 2022 at 3,740, losing 22% for the year.
In sum, the Federal Reserve’s focus on reducing inflation to its 2% target is a significant risk for stocks. Economic growth already appears to be slowing. The worst for inflation may be passing right now. The Fed may be less inclined to raise interest rates if data confirm slowing growth and inflation in the coming months. The bull market can extend its longevity if the Fed takes its foot off the interest rate pedal.
So, Will the Stock Market Go Up in 2022? Investors need to weigh the reward potential and risk rather than seek a Yes or No answer to this question.
Stocks can provide a single-digit gain in 2022 if all goes well. The downside risk to stock prices, however, exceeds the upside potential. Investors are likely to be better off leaving rallies alone in 2022. Instead, using weakness in stock prices akin to the one in January to build long-term positions can prove rewarding.
Stay on top of the stock market with ‘Looking Back, Looking Forward’
Sign up free to receive Looking Back, Looking Forward in your Inbox.
Learn more:
How AlphaProfit's investment strategy minimizes your risk
How AlphaProfit keeps your fees and expenses low
Performance of model portfolios & recommendations in AlphaProfit's Premium Service investment newsletter
AlphaProfit's free and premium investment newsletters


 DEC. 1993 to DEC. 2023