In a trend that represents a reversal from the excessive capital spending that characterized the late 1990s, many corporations have quietly been accumulating cash on their balance sheets over the past few years.
In August CFO Magazine reported that cash and marketable securities made up about 15% of total capital employed at the end of 2003, up from 11% at the end of 2001. This finding is based on REL Consultancy Group’s study of 1,000 companies spanning several industry groups.
Software companies
Rising levels of cash on a company’s balance sheet is usually a harbinger of corporate events such as initiation of or increases in dividend payments and share buybacks. For well-managed, growth-oriented companies, having additional cash can lead to a spurt in organic growth or acquisitions. The combination of a high-cash balance and an attractive valuation could make a company a takeover candidate as well. With this in mind, I set out to seek sectors and companies that stand out as “high-cash plays.”
In analyzing CFO Magazine’s Cash Management Scorecard, I focused on sectors that stand to benefit the most in increasing their return on capital employed (ROCE) by using their excess cash.
Cutting right to the chase, three sectors stand out as high-cash plays: software companies, health-care providers, and apparel retailers. REL Consultancy estimates that these three will be able to increase their ROCE by 22.3%, 6.8%, and 6.0%, respectively, by reducing their excess cash.
At the end of 2003, the cash level in the software industry was a whopping 110.3% of sales, thanks to the 41.2% increase in the cash-to-annual-sales ratio since 2001. While Microsoft (Nasdaq: MSFT) accounts for the lion’s share of the increase in cash in this sector, cash hoards at Oracle (Nasdaq: ORCL) and Siebel Systems (Nasdaq: SEBL) are nothing to sneeze at. Oracle’s cash stack is $8.6 billion tall, whereas Siebel has close to $2.1 billion in its vault.
In July, Microsoft outlined plans for using its cash and cash-generation capacity. The company put forth its $75 billion multiyear shareholder-payout program that includes dividends and share buybacks along with a $32 billion payout in a special dividend. Oracle’s pursuit of PeopleSoft appears to have hit a roadblock. What Oracle and Siebel do with their cash remains to be seen.
Health-care providers
Cash as a percentage of sales for health-care providers has bumped up by 2.7% since 2001 to reach 12.6% by the end of 2003. The more cash-rich companies here are Humana (NYSE: HUM) and PacifiCare Health Systems (NYSE: PHS). Cash levels at Humana and PacifiCare are $2.5 billion and $2.3 billion, respectively. It should, however, be noted that some of this cash is held to fulfill regulatory requirements and is, as such, not available for general corporate use.
Apparel retailers
Among apparel retailers, Gap (NYSE: GPS) and Limited Brands (NYSE: LTD) hold $4.6 billion and $1.9 billion in cash, respectively. For the most part, these two companies have contributed to the apparel retailing sector by increasing their cash-to-annual-sales ratio by 8.2% since 2001 to reach 13.8% in 2003.
Parting with cash
Balance sheets of software companies, health-care providers, and apparel retailers are ripe with cash. The impressive ability of these companies to generate operating cash flow and, to a lesser extent, divestiture activity is responsible for this cash.
In my opinion, paucity of growth opportunities is not an issue here – neither as a reason for holding additional cash, nor as a barrier to its utilization: There are bountiful opportunities for creating new software applications, offering new, cost-effective medical services, or introducing retailing concepts.
The richness in cash provides management teams in such companies the ability to pull three levers – organic growth, acquisitions, and share buybacks – to create shareholder value. However, management teams have to be savvy enough to ensure that the cash does not get bungled up in excessively risky projects or overpriced acquisitions. Seeking stuff sans sizzle is specially an issue in the software space, where product as well as technology life cycles are notoriously short. If not, the company and its cash will be foolishly parted, as in the merger of Time Warner with AOL and the acquisition of Sema by Schlumberger.
The high levels of cash in software companies, health-care providers, and apparel retailers provide investors with opportunities to seek growing dividends and EPS. For investors choosing to avoid the onerous task of evaluating management teams, no-load sector funds such as Fidelity Select Software and Computer Services and Fidelity Select Medical Delivery offer a means to capitalize on high-cash plays in software companies and health-care providers, respectively. As for apparel retailers, Fidelity Select Retailing is an acceptable alternative. Although the Fidelity Select Retailing fund does not focus exclusively on apparel retailers, the other retailing segments the fund invests in – namely broadline and specialty retailers – rank pretty high in terms of the potential to increase ROCE by paying down capital.
Sector Data in Descending Order of ROCE Impact
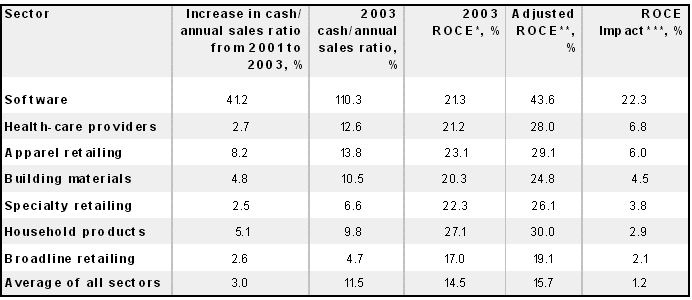
Data source: CFO Magazine (August 2004).
* Based on 2003 pretax operating profits.
** Calculated assuming excess cash is used to reduce the amount of capital employed.
*** Difference between adjusted ROCE and 2003 ROCE.
In part two, Sam Subramanian covers how selected companies might use excess cash and how investors can follow cash trails to generate investments.
Guest columnist Sam Subramanian is the managing principal of AlphaProfit Investments, a Houston-based investment research firm. Sam does not own shares in any of the companies or mutual funds mentioned in this article. The Motley Fool is Fools writing for Fools.
 The AlphaProfit ETF style rotation model portfolio will be reconstituted with new recommendations on Wednesday, November 19.

 DEC. 1993 to DEC. 2023