NTF Mutual Funds: Fidelity FundsNetwork Eases No Load No Fee Mutual Funds Rule

During volatile times like the second half of 2011, a few days can seem like eternity in the stock market. Price changes, that would normally take several months or years to materialize, transpire in just a few days. In such environments, the flexibility to change investments in no load no fee mutual funds without being tethered by rules can be a plus.

Fidelity FundsNetwork Eases NTF Mutual Funds Rule

Responding to requests from many investors including yours truly, Fidelity has relaxed its 180-day holding period requirement to allow commission free trades of no load, no transaction fee mutual funds in Fidelity FundsNetwork, Fidelity’s fund supermarket. The new rule allows investors to trade no load, NTF mutual funds commission-free after holding them for 60 days.

Fidelity has leapfrogged the competition in providing less onerous holding period requirements for offering commission-free mutual fund trades. TD Ameritrade (AMTD) requires 180 days while Schwab (SCHW), E*Trade (ETFC), and Scottrade impose a 90-day holding period requirement to waive commissions on no load NTF mutual funds.

Given the competitive nature of the brokerage industry, it could just be a matter of time before competitors catch up to Fidelity’s less stringent terms for trading no load no fee mutual funds.

Benefits of NTF Mutual Funds Rule Change

Fidelity’s rule change significantly improves the attractiveness of style rotation-based portfolios like AlphaProfit’s No Load Growth model portfolio that helps investors invest in the right mutual funds at the right time.

First, the reduction in required minimum holding period opens up more opportunities to lock gains and latch on to the next winner.

Second, the lower minimum holding period requirement considerably reduces the possibility of model portfolio users incurring brokerage commissions in their accounts during start up.

AlphaProfit No Load NTF Mutual Funds Portfolio

Fund networks like Fidelity FundsNetwork provide access to several thousands of no load no fee mutual funds, both domestic and foreign.

Cutting through the maze of options, AlphaProfit identifies the best no load, no fee mutual funds in domestic, foreign, and specialty categories for each market environment.

AlphaProfit’s ValuM fund system delves deep into each no load, no transaction fee fund … analyzing factors like quality of fund management, prospects for fund holdings, and risk of investment strategy to select winners consistently.

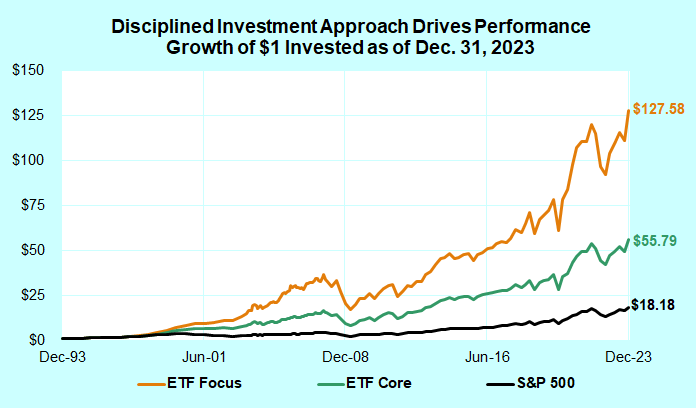
Performance of AlphaProfit no load NTF mutual funds model portfolio as of March 18, 2015.

Learn more about Free and Premium Fidelity newsletters

Launched in late 2008, the AlphaProfit NTF mutual funds model portfolio is up 142% since the start of 2009, compared to the 103% gain for its domestic and foreign markets combination benchmark. The no load no fee fund model portfolio returned 36% and 19% in 2009 and 2010, respectively.

The NTF mutual funds included in this model portfolio are typically available without transaction fee in Fidelity FundsNetwork, Schwab OneSource, and other leading fund networks.

Baron Opportunity (BIOPX), Delafield (DEFIX), Janus Overseas (JAOSX), Matthews India (MINDX), and Wasatch International Growth (WAIGX) are examples of no fee funds previously included in the AlphaProfit no transaction fee mutual funds model portfolio.

The AlphaProfit NTF mutual funds model portfolio is a worthy choice for investors pursuing profit opportunities worldwide with assets of $40,000 or more in regular or tax-qualified accounts like IRAs or Rollover IRAs.

Fidelity Magellan Mutual Fund Review and History

Tired of poor performance, Fidelity has replaced Harry Lange with Jeffrey Feingold as the manager of the Fidelity Magellan fund, FMAGX. Should you buy, sell, or hold Fidelity Magellan mutual fund shares?

With a rich history, the Fidelity Magellan fund is among the widely followed mutual funds.

Originally managed by Fidelity’s Chairman and Chief Executive Officer Ned Johnson, the fund rose to prominence under Peter Lynch’s stewardship. Managing the Fidelity Magellan fund from 1977 to 1990, Lynch averaged gains of 29% per year to crush the S&P 500 index by nearly 14% per year.

Jeffrey Vinik, who succeeded Lynch, garnered decent returns though not as spectacular as what Lynch delivered.

Fidelity Magellan shareholders have suffered from poor returns after Vinik’s departure in 1996 … first under Robert Stansky through 2005 and under Harry Lange since then.

Lange’s bets on financials like American International Group (AIG) and Wachovia during the 2008 crisis failed and damaged Magellan’’s performance. So too did his wagers on foreign companies like Nokia (NOK).

Fidelity Magellan Mutual Fund Manager Jeffrey Feingold

Fidelity Magellan Mutual Fund Manager Jeffrey Feingold

For the past five years, the Fidelity Magellan fund has trailed 97% of its peers losing at a 2.6% annual rate.

At nearly $15 billion, Fidelity Magellan mutual fund’s assets are now just a small fraction of $110 billion they tallied in 2000. During Lange’s tenure, the fund’s assets shrank by a whopping $33 billion. Lange now passes on a much-diminished Magellan to Jeffrey Feingold.

There are three reasons why long-suffering Fidelity Magellan shareholders can feel optimistic about Feingold. They include past achievements, investing style, and experience.

Past Achievements

Feingold currently manages Fidelity Trend (FTRNX), Fidelity Large Cap Growth (FSLGX), Fidelity VIP Growth Stock (FPVDC), and Fidelity Advisor Strategic Growth Fund (FTQAX).

Fidelity Trend and Fidelity Advisor Strategic Growth rank in the top 15% of large cap growth funds over the past five years. These funds along with Fidelity Large Cap Growth have performed quite well over the past year ranking in the top 10%.

Investing Style

Feingold tends to look for companies with growing earnings across all economic sectors.

While obvious choices in information technology and consumer discretionary like Apple (AAPL), Google (GOOG), and Amazon (AMZN) are among Feingold’s favorites, he extends his search beyond these sectors to other themes like nutrition, obesity, and budget-consciousness. Schiff Nutrition International (WNI), Herbalife Ltd (HLF), and Weight Watchers International (WTW) are among the names Feingold likes.

Looking at U. S. versus foreign allocation, Feingold prefers the U. S. … at least currently. His funds on average have about 10% of their assets invested in foreign stocks compared to Magellan’s 23%.

Experience

Feingold has risen through the ranks at Fidelity, managing sector funds like Fidelity Select Financial Services (FIDSX), Fidelity Select Consumer Finance (FSVLX), and Fidelity Select Defense & Aerospace (FSDAX) as well as the equity sleeves of Global Balanced (GBALX) and Fidelity Worldwide (FWWFX). Feingold’s hands on experience in the financial sector can come in handy during these strained economic times.

The opportunity to manage the Fidelity Magellan Fund is a big step up for Feingold. Fidelity Trend, the largest of the funds managed by Feingold currently has around $1 billion in assets, a small fry compared to Fidelity Magellan. It remains to be seen if Feingold can translate his success with the smaller funds to a larger Magellan.

All-in-all, Fidelity Magellan mutual fund is a Hold. Fidelity Magellan fund shareholders should consider holding their shares to see if Feingold can reduce their pain of years of underperformance. Others should not bother with history. Feingold’s Fidelity Magellan fund is worth watching from the sidelines … at least for now.

Best Natural Gas Mutual Funds and Natural Gas ETFs

Read this article to learn how you can maximize return from the best natural gas mutual funds, best natural gas ETFs, and best natural gas stocks.

Excess natural gas production from shale formations resulted in a supply glut in 2010 and pressured natural gas prices.

Planned cuts in natural gas production at the beginning of this year crimped supply. Rising industrial demand, a colder-than-normal winter, and an extremely hot July have since then contributed to an increase in demand. The shrinking gap between natural gas demand and supply has helped to work off excess inventories. Natural gas inventory levels have declined over 4% from the year-ago level; they are now 2% below their 5-year average.

Inventories are likely to tighten further if power producers continue shifting from coal and fuel oil to cleaner burning natural gas. Natural gas prices can increase as inventories tighten.

Natural gas futures traders support this bullishness. NYMEX natural gas futures rise from $3.93 per MMBTU for October 2011 delivery to $4.25 for December 2011 delivery. The price for December 2012 delivery rises 26% to $4.95. The price curve rises through 2014 in a virtual straight-line tagging another 12%. The contract for December 2014 delivery changes hands at $5.56.

With natural gas futures pointing higher, investors stand to reap solid rewards by investing in the best natural gas mutual funds, best natural gas ETFs, and best natural gas stocks.

Growth as well as income investors can profit from an expected increase in natural gas prices by investing in the best natural gas mutual funds, best natural gas ETFs, and best natural gas stocks.

Rising natural gas demand and prices translates into opportunity for companies in different segments of the gas value chain. They include natural gas producers, service firms and natural gas distributors. This in turn opens up investment opportunities for mutual fund, ETF, and stock investors looking for growth as well as income.

Best Natural Gas Mutual Funds for Growth

Fidelity offers a wide range of actively managed sector mutual funds under the Fidelity Select funds family. Fidelity Select Natural Gas (FSNGX) is a pure-play no-load natural gas mutual fund. See: How to choose the best Fidelity Select fund

Best Natural Gas Mutual Funds for Income

FBR Gas Utility Index (GASFX) appeals to investors seeking income from investments in natural gas transportation and distribution companies. This natural gas mutual fund invests in utilities, master limited partnerships, and other companies included in the American Gas Association Stock Index.

Best Natural Gas ETFs for Growth

First Trust ISE-Revere Natural Gas Index ETF (FCG) is a pure-play natural gas ETF investing in natural gas exploration, production, and service companies. See: Invest in the Best Sector ETFs Consistently

Best Natural Gas ETFs for Income

JP Morgan Alerian MLP Index ETN (AMJ) and Alerian MLP ETF (AMLP) invest in U. S. energy infrastructure master limited partnerships. While the ETN tends to be more volatile and can offer higher return potential in bull markets, investors seeking tax-deferred distributions usually prefer the ETF structure.

Best Natural Gas Stocks for Growth

Devon Energy (DVN) has successfully transformed itself as a high-growth onshore company and emerged as the largest natural gas producer in the Barnett shale. Devon’s dominant position in the Barnett shale is complemented with liquids rich-assets in the Permian Basin. Devon has a well-defined program for increasing production and strong cash flow from current operations should help fund growth prospects. Devon Energy’s EPS is likely to increase 21% in 2012 and another 20% in 2013.

National Fuel Gas (NFG) is poised to benefit from growth in production and transportation volumes of natural gas. NFG is one of the biggest leaseholders in the Marcellus shale formation with 745,000 acres. Marcellus shale is likely to help NFG increase its total production by over 30% next year. The diversified gas company should also see higher profits from its expanding gas pipeline network. NFG’s EPS is likely to increase 13% in 2012 and another 19% in 2013.

Best Natural Gas Stocks for Income

Targa Resouces (NGLS) is a limited partnership engaged in the business of gathering and selling natural gas and natural gas liquids. This partnership’s competitive position is strong by virtue of its access to Henry Hub, the largest U. S. natural gas hub, along with a formidable NGL distribution system in Louisiana and the southeast. Targa’s NGL business benefits from the wide price differential between crude oil and natural gas. Targa has increased its dividend distribution by over 10% since 2009 and its stock currently yields nearly 7%.
Williams Partners (WPZ) provides natural gas to utilities and natural gas liquids to petrochemical companies. The limited partnership’s investments in the Marcellus Shale, Piceance Basin, and Gulf of Mexico are paying off. Williams is expanding pipeline capacity as utilities increasingly switch to natural gas-fired power plants and demand for NGLs from petrochemical companies stays strong. Williams’ dividend payout is very well covered by distributable cash flow even though the partnership has raised dividends for six straight quarters. The limited partnership’s shares yield nearly 5.4% and the distributions are likely to increase between 6% and 10% in 2012.

Beat the Market with Best Natural Gas Mutual Funds and Best Natural Gas ETFs

While growing demand for natural gas can make natural gas investments suitable for long-term investing, you can use such investments as part of a broader sector investing strategy to earn bigger rewards.
Like most sector investments, natural gas investments periodically come in and go out of favor based on investor’s view of near-term prospects for natural gas companies.

AlphaProfit’s Investments Newsletters help you invest in the best natural gas mutual fund and best natural gas ETF at the right time.
When the timing is just not right for natural gas mutual funds or natural gas ETFs, you will stay away from them and invest only in the best sector mutual funds and best sector ETFs in the top ranked sectors.

E-commerce ETF and E-commerce Fund: Two Investments to Profit from Guaranteed Growth

During times when sustained growth of the U. S. economy appears less than certain, e-commerce ETF and e-commerce fund represent two investments that can deliver solid gains from virtually assured growth of the e-commerce industry.

According to Forrester Research, the U. S. e-commerce industry grew 12.6% in 2010 to $176 billion. The market research firm expects the U. S. e-commerce industry to expand by 60% to $279 billion in 2015.

The growth of e-commerce in retailing & entertainment, advertising, and travel can support the industry’s expansion.

E-commerce Stocks in Retailing & Entertainment

The number of consumers shopping online is increasing as unemployment levels rise, transportation costs soar, and e-retailers provide incentives like free shipping. Smartphones and tablet computers are the most popular items sold online.

Improvement in download speed and reliability is prompting increasing number of consumers to fulfill their entertainment wants online. Purchases or renting of books, music, video, and games are rapidly moving online.

Amazon.com (AMZN) and eBay (EBAY) are dominant online retailers while Netflix (NFLX) has entrenched itself in online movie delivery. Groupon, which is reshaping e-commerce with short-life discount coupons from local stores, has filed an S-1 with the intent of becoming public.

E-commerce Stocks in Advertising

Online ad spending in the U. S. is poised for strong growth as more people spend more time online. eMarketer forecasts ad spending to increase by over 20% to $31 billion in 2011 as new formats like video and new channels like mobile and social media gain adoption.

While search accounts for a major share today, growing popularity of video and brand-building ads is helping display ad spending to power ahead. Spending on display ads is expected to exceed spending on search ads by 2015.

Investment opportunities here include shares of search leaders Google (GOOG), Yahoo! (YHOO), and Microsoft (MSFT). Smaller service providers like ValueClick (VCLK) represent potential takeover plays. Facebook and LinkedIn (LNKD) are capitalizing on the growing popularity of social media.

E-commerce Stocks in Travel

eMarketer estimates online sales of leisure and unmanaged business travel in the U. S. will increase 8.5% this year on higher airfares, hotel rates, and ancillary fees. Nearly 11.8 million new users are forecasted to make their travel booking through mobile devices.

Overseas, online airline ticket purchases and hotel reservations are increasing at a breakneck pace. Growth is notably strong in China, South Korea, Brazil, Russia and India from both increasing domestic and international travel.

Online travel and related services companies like Expedia (EXPE), priceline.com (PCLN), and to a lesser extent Orbitz Worldwide (OWW) stand to benefit from the increase in online bookings.

Investing in E-commerce ETF and E-commerce Fund

You can profit from the e-commerce industry’s growth by investing in e-commerce stocks mentioned above. However, investing in an individual e-commerce stock carries company-specific risk. You can reduce such risk by investing in e-commerce sector ETFs and sector mutual funds. E-commerce ETF and e-commerce fund examples are provided in the inserts.

Beat the Market with Best E-commerce ETF and E-commerce Fund Investments

While secular growth characteristics make e-commerce ETF and e-commerce fund investments suitable for long-term investing, you can use such investments as part of a broader sector investing strategy to earn bigger rewards.

Like most sector investments, e-commerce ETF and e-commerce fund investments periodically come in and go out of favor based on investor’s view of near-term prospects for e-commerce stocks.

AlphaProfit’s Premium Service helps you invest in the best e-commerce ETF and the best e-commerce fund at the right time. When the timing is just not right for e-commerce ETF and e-commerce fund investments, you will stay away from them and invest in only the best sector ETFs and best sector mutual funds in top ranked sectors.

The sector ETF and sector fund model portfolios use AlphaProfit’s proven ValuM investment process for selecting investments. This process has enabled AlphaProfit model portfolios to bag Dow Jones Hulbert Financial’s #1 rank numerous times.

A dollar invested in the AlphaProfit’s Aggressive Growth (ETF-Focus) and Capital Appreciation (ETF-Core) model portfolios is worth $30.80 and $14.93, respectively. This implies annualized returns of 20.2% and -ssi-16.2%, respectively.

etf-performance-etf-model-portfolio-investment-process-a

Comparable investments in the Dow Jones Wilshire 5000 and S&P 500 benchmarks are worth $6.42 and $6.32, respectively implying annualized returns of 9.4% and 9.3%, respectively.

Learn 5 Smart Ways of Using Sector ETFs and Sector Funds

Sign up for AlphaProfit’’s Free ETF Newsletter MoneyMatters and receive your Free Report on 5 Smart Ways of Using Sector ETFs and Sector Funds.


Low Risk Mutual Funds for a Slow Growth Economy

Low risk mutual funds do not have to be low return mutual funds. This article features four low risk mutual funds capable of delivering decent returns in a slow growth economy.

Stock prices declined for six straight weeks from May through June as measures of U. S. manufacturing and services activities painted a picture of slowing economic growth.

Fears of global economic growth being impacted by the European sovereign debt crisis and by rising interest rates in emerging Asia also dented stock prices.

As investor fears rose and the put-call ratio spiked, stock prices made a U-turn and staged their strongest rally since September.

The S&P 500 ($SPX) rallied nearly 6% in a matter of five days on better-than-expected U. S. manufacturing and housing data.

So, what does one make of this economy? Is it time to get out of stocks?

The economy is transitioning from recovery to one of slow but sustained growth.

As for stocks … defense is the best offense.

Stock valuation metrics are compelling. The forward P/E on the S&P 500 is in the lowest deciles of values we have seen since 1985.

Stocks in defensive groups offer a good way to earn some decent returns in this slow growth environment.

With this in mind, I have picked four low risk investment options for this slow growth milieu. All of them are low risk mutual funds that are available transaction cost-free in Fidelity FundsNetwork.

Three of them invest in specific sectors; the fourth one is a play on fat dividends.

Low Risk Mutual Fund Option #1: Fidelity Select Consumer Staples – FDFAX

Demand for products like food, beverages, and personal care products tends to be immune to the vagaries of the economy. Oftentimes, investors gravitate towards stocks of consumer staples companies during periods of slow economic growth as their ability to steadily grow earnings becomes a virtue.

While many investments in the consumer staples sector can be dull and boring, Fidelity Select Consumer Staples (FDFAX) spices things up by investing in companies with sizeable exposure to emerging markets. Examples include Coca-Cola (KO) and British American Tobacco (BTI) that are among the fund’s top three holdings.

Low Risk Mutual Fund Option #2: Fidelity Select Health Care – FSPHX

Demand for health care products and services tends to be relatively stable and resilient to economic cyclicality. Valuation metrics of health care stocks tend to expand during the later stages of the business cycle when economic growth is no longer strong and uniform.

Against this positive backdrop, the profitability of the health care industry is being affected by the U. S. government’s efforts to rein burgeoning health care costs. As such, certain segments of the health care industry are positioned to perform better than others.

Fidelity Select Healthcare (FSPHX) is a no load mutual fund that has latched on to some themes and firms that are likely to be winners.

Fidelity Select Healthcare’s top holdings include Medco Health Solutions (MHS) that offers pharmacy-benefits management services to help reduce health care costs, Illumina (ILMN) that develops genetic analysis technology to spur personalized medicine, and Edwards Lifesciences (EW) that develops innovative medical devices for cardiovascular diseases.

Low Risk Mutual Fund Option #3: American Century Utilities – BULIX

Demand for electricity, gas, and water tends to be stable. Utility companies enjoy large, predictable cash flows and pass most of their profits to shareholders as dividends.

Dividend payments provide investors with income while oftentimes making the stocks less volatile.

American Century Utilities (BULIX) is among the lower risk utility mutual funds. The fund reduces risk by mixing telecom, electric, and energy utility companies.

American Century Utilities’ top holdings include telecom service provider AT&T (T), electric utility Public Services Enterprises (PEG), and energy pipeline operator ONEOK (OKE).

Low Risk Mutual Fund Option #4: American Century Equity Income – TWEIX

One can easily extend the appealing idea of using dividends to earn an income and reduce stock price volatility beyond utility stocks.

Equity income funds invest in stocks of dividend-paying companies across sectors. American Century Equity Income (TWEIX) is an example of an equity income fund.

Several dividend aristocrats that have raised dividends consecutively for at least 25 years feature among American Century Equity Income’s top 10 holdings. They include ExxonMobil (XOM), 3M (MMM), Johnson & Johnson (JNJ), Procter & Gamble (PG), and Consolidated Edison (ED).

American Century Equity Income’s 2.8% dividend yield handily beats the S&P 500’s 1.7% yield. It also competes quite favorably with the 10-year Treasury bond’s 3.1% yield when one factors the possibility of the fund’s dividend income increasing over time.

In sum, Fidelity Select Consumer Staples, Fidelity Select Health Care, American Century Utilities, and American Century Equity Income are four low risk mutual funds capable of delivering meaty returns in a slow growth economy.

Auto ETFs: First Trust CARZ and Global X VROM

The automotive sector has been among the top performers since the U. S. economy emerged from the Great Recession. The DJ U.S. Automobiles & Parts index ($DJUSAP) is up over 330% from the March 2009 bottom.

Until now, Fidelity Select Automotive (FSAVX) has been the sole pure-play vehicle for investors looking to invest in the auto sector via bundled products.

ETF investors had to content themselves with surrogate plays like SPDR S&P International Consumer Discretionary ETF (IPD), ETFS Physical Palladium (PALL), or ETFS Physical Platinum (PPLT) to play the auto cycle.

Two Pure-Play Auto ETFs

Now, two pure-play sector ETFs are available for investing in the auto sector. First Trust came out with the NASDAQ Global Auto Index ETF (CARZ) on May 10. Soon after, Global X launched the Global X Auto ETF (VROM) on May 19.

The two sector ETFs differ in two respects: coverage of sub-industries and geography.

First Trust Auto ETF – CARZ

First Trust NASDAQ Global Auto Index ETF focuses on global automakers. Its underlying index includes 32 automakers from nine developed and emerging market countries.

Automakers from U.S., Western Europe and Japan account for 82% of the ETF’s assets. The top ten holdings make up 60% of the ETF’s assets. They include German automakers Daimler (DDAIF.PK), Volkswagen (VLKAY.PK) & BMW (BAMXY.PK), U.S. automakers Ford (F) & General Motors (GM), and Japanese automakers Toyota Motor (TM) & Honda Motor (HMC).

Automakers in China, Korea, Malaysia and Taiwan are allocated 18% of the ETF’s assets.

Global X Auto ETF – VROM

Global X Auto ETF (VROM) based on S-Network Global Automotive Index includes stocks of the 50 largest companies in the auto industry. Currently automakers, auto parts companies, and tire makers make up 74%, 19%, and 7%, respectively of this ETF.

Global X Auto ETF includes many of the automakers in the First Trust Auto ETF. Additionally, the Global X Auto ETF features automaker Tata Motors (TTM), auto parts makers Johnson Controls (JCI) & Magna International (MGA), and tire maker Goodyear Tire & Rubber (GT).

Capping off individual country allocation at 25%, Global X Auto ETF currently invests nearly 80% of its assets in developed markets. Emerging market autos and auto parts companies make up the remaining 20%.

AlphaProfit Take on Auto ETFs

The long-term future of the auto industry appears bright particularly in emerging markets. Wards Auto projects global auto sales to increase by 38% to 107 million units in 2020 from about 77 million units in 2011. While sales are expected to increase about 5% in the developed world, they are forecasted to grow between 60% and 160% in the individual BRIC countries.

As such, investments in auto ETFs are a play on consumer demand in emerging markets. While First Trust Global Auto ETF provides focused exposure to automakers, Global X provides broader exposure to auto, auto parts, and tire companies. In future, investors could have one more choice for auto ETFs with DireXion Funds having registered for one.

Like any sector ETF, one has to get the timing right with auto ETFs to avoid losses and earn outsized returns. These newly-introduced auto ETFs do not generate much enthusiasm from a timing perspective.

With auto stocks already up well over triple digits from the March 2009 bottom and monetary policies in emerging economies now getting tighter, the auto cycle appears to be closer to its top rather than its bottom.

Patient investors willing to wait until the bottom of the auto cycle can look to auto ETFs like First Trust Global Auto ETF and Global X Auto ETF to capture the next auto cycle upswing.

AlphaProfit ETF Model Portfolios and ETF Investment Newsletter

AlphaProfit’s proven ETF selection process enables thousands of investors to thrive in turbulent markets.

A dollar invested in the AlphaProfit’s Aggressive Growth (ETF-Focus) and Capital Appreciation (ETF-Core) model portfolios is worth $47.59 and $24.57, respectively. This implies annualized returns of 19.9% and 16.3%, respectively.


Performance of ETF model portfolios as of March 31, 2015.

Sign up for ETF Newsletter

Comparable investments in the Dow Jones Wilshire 5000 and S&P 500 benchmarks are worth $6.85 and $6.70, respectively implying annualized returns of 9.5% and 9.4%, respectively.

The ETF model portfolios use AlphaProfit’s proven ValuM investment process for selecting investments. This process has enabled AlphaProfit model portfolios to bag Hulbert Financial’s #1 rank numerous times.

Fidelity Select Chemicals and Chemical ETFs: Why Invest?

Fidelity Select Chemicals and Chemical ETFs look attractive, as potential for margins to widen and deal activity to provide abnormal returns sustain the leadership of chemical stocks.

Selected groups in the consumer discretionary and technology sectors like auto and computers led the way in 2009 as stock prices started to recover from the Great Recession.

In 2010, the leadership shifted to groups like transportation.

In recent months, stock prices in groups like auto, computers, and transportation have sputtered.

The chemicals group is different in this regard. Shares here performed well in both 2009 and 2010 and they continue to fare well in 2011.

Over the past year, the Dow Jones Chemicals Titans 30 Index ($DJACHE) is up 31.8% while the actively managed Fidelity Select Chemicals Fund (FSCHX) is up 34.7% compared to the 12.8% advance of the S&P 500 ($SPX).

With industry margins likely to widen and deal activity adding spice, chemical company stocks have a few things going for them that can help them sustain their leadership.

Fidelity Select Chemicals - Chemical ETF

The outlook for Fidelity Select Chemicals FSCHX and selected chemicals ETFs looks bright. Demand for chemicals from end users in agriculture, auto manufacture, and global construction is increasing. Mergers add to investment appeal.

Chemical Industry Profits to Continue Rising

Chemical companies cut costs to the bone during the downturn. With the economy now growing, product demand in individual industry segments is increasing. The resulting operating leverage is helping chemical companies widen their margins.

Agricultural Chemicals: The secular forces of global population growth and higher per-capita income in emerging economies are lifting commodity crop prices. The United Nations reports that global food costs are at record levels.

High crop prices provide significant incentive for farmers to increase acreage and yields. The U.S. Department of Agriculture recently stated that U. S. corn acreage this year would be second highest in 67 years.

Fertilizer producers like Potash Corporation (POT) and Agrium (AGU) as well as seed developers like Monsanto (MON) and DuPont (DD) stand to benefit from the drive to increase farm output.

Petrochemicals and Plastics: Demand for petrochemicals and plastics is rising from growth in emerging markets and recovery of the auto industry.

Global capacity utilization for ethylene production, a bellwether for plastics manufacture, is forecasted to increase to 90% by 2013 from 84% in 2009.

The automotive industry accounts for 10% of U. S. chemical industry demand. Plastics manufacture should receive a boost as global auto demand approaches 76 million units.

Dow Chemical (DOW), BASF Corp. (BASFY.PK) and LyondellBasell Industries (LYB) are among the world’s top petrochemicals and plastics producers. Ample supply of shale natural gas particularly in the U. S. should help their margins.

Specialty Chemicals and Building Materials: Specialty chemical stocks typically tend to perform well in early to mid-cycle phases of economic recoveries as demand increases to drive volume growth.

Solutia (SOA), which makes various chemical and engineered materials used in consumer and industrial applications, is well-positioned to benefit from increasing global construction activity.

Building products manufacturer U.S. Gypsum (USG), roofing products manufacturer Owens Corning (OC), and paint manufacturers Sherwin Williams (SHW) & Valspar (VAL) too can fare well in varying degrees.

Mergers & Acquisitions Add to Investment Appeal

Deal activity in the chemical industry is continuing at a healthy pace as valuation metrics are attractive and companies seek to grow revenue.

Legendary investor Warren Buffett is seeing value in chemical companies. Berkshire Hathaway (BRK-B) recently announced that it is acquiring Lubrizol (LZ) for $9 billion.

Earlier, DuPont offered to buy Denmark’s Danisco (DNSOF.PK) for $6 billion to expand into biofuels and food enzymes. Air Products & Chemicals (APD) went after Airgas (ARG) in hot pursuit until the latter succeeded in staying independent by getting court approval of its poison pill provision.

Mutual Funds and ETFs to Invest in the Chemicals Group

There are several options available for investors to play the chemicals group.

Fidelity Select Chemicals – FSCHX

Among mutual funds, several index and actively managed funds invest in the materials sector. However, when it comes to the chemicals group in particular, Fidelity Select Chemicals is the only pure-play mutual fund that focuses on this group.

Chemical ETFs

In the ETF space, there is no pure-pay chemical ETF. However, several basic materials and agriculture ETFs can work as suitable proxies since many of them have 40% or more of their assets invested in chemical stocks.

Market Vectors Agribusiness (MOO), Materials Select Sector SPDR (XLB), iShares DJ US Basic Materials (IYM), Vanguard Materials (VAW), and PowerShares Global Agriculture (PAGG) fit this description and have net assets of over $100 million each.

Global X FTSE Southeast Asia ETF – ASEA – Review

Investors seeking exposure to emerging markets generally consider broadly diversified exchange-traded funds like Vanguard MSCI Emerging Markets ETF (VWO) or iShares MSCI Emerging Markets ETF (EEM).

A few regional ETFs are available offering exposure to emerging markets in different geographic regions. They include iShares MSCI Emerging Markets Eastern Europe ETF (ESR) and iShares S&P Latin America 40 ETF (ILF).

The rapid economic growth of Brazil, Russia, India, and China has made investing in the BRIC theme highly popular. iShares MSCI BRIC ETF (BKF) is an example of this thematic ETF. Another thematic ETF is iShares S&P Emerging Markets Infrastructure ETF (EMIF) to profit from infrastructure build-out programs in emerging markets.

Now a new option has become available for investment specifically in ASEAN countries … the Global X ASEAN ETF (ASEA). This ETF seeks to match the performance of stocks included in the FTSE ASEAN 40 Index.

What is ASEAN

ASEAN, an acronym for Association of Southeast Asian Nations, is a group of countries seeking to accelerate economic growth through mutual free trade. The association includes Indonesia, Malaysia, the Philippines, Singapore, and Thailand as the founding members along with Brunei, Cambodia, Laos, Myanmar and Vietnam.

 Global-X-Asean-ETF-Asea-Review

Global X ASEAN ETF (ASEA) invests in Indonesia, Malaysia, the Philippines, Singapore, and Thailand, the founding members of the Association of Southeast Asian Nations.

Investments in the Global X ASEAN ETF

The Global X ASEAN ETF invests in the 40 largest companies in the founding members of ASEAN. The current weightings for these countries are as follows: Singapore 41.2%, Malaysia 32.8%, Indonesia 14.8%, Thailand 10.6%, and the Philippines 0.6%.

Why invest in Global X ASEAN ETF

Singapore features in the MSCI Developed Markets Index. The other four founding members of ASEAN are among the fastest growing emerging nations, benefiting from foreign direct investments, low labor costs, and strengthening relationship with China. A rapidly expanding affluent middle class, that is estimated to touch 300 million by 2015, is driving demand for a variety of consumer goods and services.

How to invest in Global X ASEAN ETF

The Vanguard MSCI Emerging Markets ETF and the iShares MSCI Emerging Markets ETF invest in a broad range of emerging market countries from Brazil to Turkey. As such, only 6% to 7% of assets are invested in Indonesia, Malaysia, Thailand, and the Philippines, the emerging economies of ASEAN.

To increase exposure to the ASEAN block, investors can take a core and satellite approach with Vanguard MSCI Emerging Markets ETF or the iShares MSCI Emerging Markets ETF as the core and Global X ASEAN ETF as the satellite part of their emerging market ETF portfolio. For more on ETF portfolio construction, see: Best ETFs to Build Your ETF Portfolio

Alternative to Global X ASEAN ETF

In lieu of investing in Global X ASEAN ETF, investors can also invest in ETFs specific to individual countries in the FTSE ASEAN 40 Index. They are iShares MSCI Indonesia ETF (EIDO), iShares MSCI Malaysia ETF (EWM), iShares MSCI Philippines ETF (EPHE), iShares MSCI Singapore ETF (EWS), and iShares MSCI Thailand ETF (THD).

Risk of Investing in Global X ASEAN ETF

Over 40% of Global X ASEAN ETF’s assets are invested in Singapore and nearly 75% of the ETF’s assets are invested in Malaysia and Singapore, posing country concentration risk. Another risk is the dependence of ASEAN countries on China. Like other emerging markets ETFs, Global X ASEAN ETF carries foreign currency, inflation, and political risks.

AlphaProfit ETF Model Portfolios and ETF Investment Newsletter

AlphaProfit’s proven ETF selection process enables thousands of investors to thrive in turbulent markets.

A dollar invested in the AlphaProfit’s Aggressive Growth (ETF-Focus) and Capital Appreciation (ETF-Core) model portfolios is worth $47.59 and $24.57, respectively. This implies annualized returns of 19.9% and 16.3%, respectively.

Performance of ETF model portfolio driven by disciplined investment process

Performance of ETF model portfolios as of March 31, 2015.

Sign up for ETF Newsletter

Comparable investments in the Dow Jones Wilshire 5000 and S&P 500 benchmarks are worth $6.85 and $6.70, respectively implying annualized returns of 9.5% and 9.4%, respectively.

The ETF model portfolios use AlphaProfit’s proven ValuM investment process for selecting investments. This process has enabled AlphaProfit model portfolios to bag Hulbert Financial’s #1 rank numerous times.

Best Oil ETFs – Looking Beyond Energy Select SPDR XLE

Investors looking to invest in oil ETFs or energy ETFs often gravitate towards the Energy Select Sector SPDR (XLE). With over $8 billion in assets, the Energy Select Sector SPDR may appear as the best oil ETF.

Investing in energy companies included in the S&P 500 index, the Energy Select SPDR provides exposure to a broad range of oil companies at a modest 0.21% expense ratio.

This however does not mean that the Energy Select Sector SPDR is the best oil ETF.

In fact, nearly 15 oil ETFs performed better than the Energy Select SPDR in 2010.

The ETF marketplace has grown over time. Now, several oil ETFs are available to achieve a number of investment objectives.

Broadly speaking, oil ETFs can be classified into four types:

  • Oil stock ETFs
  • Oil commodity ETFs
  • Leveraged oil ETFs
  • Short oil ETFs

In this article, I shall focus on oil stock ETFs. I have discussed commodity ETFs elsewhere. See: Commodity Exchange Traded Funds: Best Commodity ETFs

Oil Stock ETFs

This class of oil ETFs can be divided into five types:

Best-Oil-ETFs

ETFs that owned oil exploration and production stocks were the best oil ETFs in 2010. Oil service ETFs and natural gas ETFs can be strong contenders for being the best oil ETFs in 2011.

Oil Exploration & Production ETFs

ETFs like iShares Dow Jones US Oil & Gas Exploration & Production ETF (IEO), PowerShares Dynamic Energy Exploration & Production (PXE), and SPDR S&P Oil & Gas Exploration & Production ETF (XOP) invest in stocks of companies like Apache (APA), EOG Resources (EOG), and Occidental Petroleum (OXY) that produce oil & gas.

Oil Services ETFs

ETFs like iShares Dow Jones US Oil Equipment ETF (IEZ), Oil Services HOLDRs (OIH), PowerShares Dynamic Oil & Gas Services (PXJ), and SPDR S&P Oil & Gas Equipment & Services (XES) invest in stocks of companies like Schlumberger (SLB), Halliburton (HAL), and National Oilwell Varco (NOV) that provide drilling equipment and services to oil companies.

Natural Gas ETFs

ETFs like First Trust ISE-Revere Natural Gas ETF (FCG) invest in stocks of companies like Chesapeake Energy (CHK), Devon Energy (DVN), and Southwestern Energy (SWN) that produce natural gas.

Diversified Oil ETFs

ETFs like Energy Select SPDR ETF, Vanguard Energy ETF (VDE), and iShares S&P Global Energy ETF (IXC) invest in a broad range of energy companies that includes integrated oil companies like Chevron (CVX), ConocoPhillips (COP), and ExxonMobil (XOM), as well as oil producers, refiners, and oil service companies. While the Energy Select SPDR ETF and the Vanguard Energy ETF invest in U. S.-based companies, iShares S&P Global Energy ETF invests in energy companies across the globe.

Oil Income ETFs

ETFs like JPMorgan Alerian MLP ETN (AMJ) and ALPS Alerian MLP ETF (AMLP) invest in energy companies structured as master limited partnerships. Enterprise Products Partners (EPD), Kinder Morgan Energy Partners (KMP), and Magellan Midstream Partners (MMP) are examples of such companies. Such companies pay a large portion of their profits as dividends, making these oil ETFs suitable for income investors.

Best Oil ETFs

Among oil stock ETFs, PowerShares Dynamic Energy Exploration & Production took top honors in 2010 gaining 40%. PowerShares Dynamic Energy (PXI) trailed the leader by less than a 1%. JPMorgan Alerian MLP gained a solid 33% to deliver income investors a sizzling return.

The above returns are quite impressive in light of the fact that Direxion Daily Energy Bull 3X Shares (ERX), using a leverage ratio of three, gained 49% in 2010.

Best Oil ETF for 2011

In the latter part of 2010, oil prices were favorably impacted by two factors: rising demand for oil and a falling dollar.

Demand for oil increased as emerging economies such as China and India grew rapidly and developed economies recovered from the Great Recession. Measures taken by the Federal Reserve and the Obama Administration to aid economic recovery pressured the U. S. dollar and provided a boost for dollar-denominated oil.

Things however did not work well for natural gas. Weak industrial demand coupled with relatively high production caused natural gas inventories to bulge. The price of natural gas declined in 2010.

A steady increase in the price of oil is encouraging oil companies to increase exploration & production spending. Energy services heavyweights Schlumberger and Halliburton are expected to increase EPS by over 36% in 2011.

If the price of oil continues to be favorably influenced by rising demand for oil and a falling dollar, oil services ETFs like iShares Dow Jones US Oil Equipment ETF, PowerShares Dynamic Oil & Gas Services, or SPDR S&P Oil & Gas Equipment & Services can be top contender for being the best oil ETF in 2011.

Likewise, natural gas ETFs should not be counted out, particularly if higher demand from increasing economic activity starts to work off excess inventories. Natural gas appeals as a contrarian investing idea and Natural Gas First Trust ISE-Revere Natural Gas ETF too has the potential to emerge as the best oil ETF in 2011.

AlphaProfit ETF Model Portfolios and ETF Investment Newsletter

AlphaProfit’s proven ETF selection process enables thousands of investors to thrive in turbulent markets.

A dollar invested in the AlphaProfit’s Aggressive Growth (ETF-Focus) and Capital Appreciation (ETF-Core) model portfolios is worth $47.59 and $24.57, respectively. This implies annualized returns of 19.9% and 16.3%, respectively.

etf-performance-etf-model-portfolio-investment-process-v2

Performance of ETF model portfolios as of March 31, 2015.

Sign up for ETF Newsletter

Comparable investments in the Dow Jones Wilshire 5000 and S&P 500 benchmarks are worth $6.85 and $6.70, respectively implying annualized returns of 9.5% and 9.4%, respectively.

The ETF model portfolios use AlphaProfit’s proven ValuM investment process for selecting investments. This process has enabled AlphaProfit model portfolios to bag Hulbert Financial’s #1 rank numerous times.

Commodity Exchange Traded Funds: Best Commodity ETFs

Commodity exchange traded funds are hot. Assets in SPDR Gold Shares (GLD) have surged to nearly $60 billion to make it the second largest ETF behind the SPDR S&P 500 ETF (SPY).

The threat of inflation and the ease of access of commodity ETFs are some factors that account for the growing popularity of commodity exchange traded funds.

iPath DJ-UBS Cotton ETN (BAL) takes the honor for being the best commodity ETF in 2010 with a sizzling 77% gain. iShares Silver Trust (SLV) takes the second spot with a 70% advance.

Not all commodity ETFs have been winners. United States Natural Gas (UNG), iPath DJ-UBS Cocoa ETN (NIB), and iPath DJ-UBS Lead (LD) cluster at the other end of the performance spectrum losing 40%, 11%, and 5%, respectively.

Given such differences in performance are plausible even within a seemingly related group of ETFs, how does one analyze and choose the best commodity ETF?

Commodity-Exchange-Traded-Funds-Best-Commodity-ETFs-1

Commodity exchange traded funds can be classified into four broad categories: agriculture, energy, precious metals, and industrial metals. The article spells out best commodity ETFs within each category.

To get a grip on this, it is useful to group commodities into major complexes and understand key factors that often tend to drive prices within each complex.

Agricultural Commodity ETF

As demand for agriculture commodities is steadily growing due to a rise in global population, variation in supply is often the major driver of price changes. Weather changes to a large degree account for variability in supply.

Best Commodity ETF

PowerShares DB Agriculture (DBA) which invests in cattle feeder, cocoa, coffee, corn, cotton, lean hogs, live cattle, soybeans, sugar, and wheat.

Energy Commodities ETF

There are three types of energy commodities: oil, natural gas, and products like gasoline & heating oil. The price of energy commodities in general tends to be sensitive to the level of economic activity. While oil is an international commodity whose price is subject to global supply and demand forces, natural gas is primarily a domestic commodity. In products markets, local industrial activity is the main demand driver. Product specifications and availability of refining capacity are among the factors that impact supply.

Top Commodity Exchange Traded Funds

  • PowerShares DB Energy (DBE) which invests in a basket of energy commodities including crude oil, heating oil, gasoline and natural gas.
  • PowerShares DB Oil Fund (DBO) and United States Natural Gas (UNG) for investors seeking focused exposure to oil and natural gas, respectively.
  • Precious Metals ETF

    Investor see precious metals as an inflation hedge as well as a safe-haven against financial or political turmoil. Prices of precious metals often move with little or no correlation to stock prices. As such, precious metal investments play a useful role in portfolio diversification and risk management.

    Top Commodity Exchange Traded Funds

    SPDR Gold Shares (GLD) and iShares Silver Trust (SLV) which invest in gold and silver, respectively.

    Industrial Metals ETF

    The wide use of industrial metals in construction and manufacturing industries makes their prices sensitive to level of economic activity. In recent years, this relationship is distorted by nations like China that build base metal inventories for their ‘strategic value’. Combining economic sensitivity with ‘strategic value’, industrial metals have the characteristics of both energy commodities and precious metals.

    Best Commodity ETF

    PowerShares DB Base Metals (DBB) invests in aluminum, copper, and zinc.

    Diversified Commodity ETF

    Investors looking for a one-stop commodity exchange traded fund have the choice of investing in PowerShares DB Commodity Index Tracking Fund (DBC). This ETF provides exposure to 14 commodities including agricultural commodities, energy commodities, precious metals, and industrial metals.


Considerations for Investing in Commodity Exchange Traded Funds

Prices of commodity exchange traded fund are influenced by three major factors:

  • Changes in spot commodity prices
  • Shape of the forward price curve, i.e., spot/futures price convergence
  • Short term interest rates

To earn the best returns with commodity ETFs, investors need to analyze all of the three factors.

The commodity ETF’s management strategy plays a key role in determining returns. The spot price may move favorably. Yet, the commodity ETF’s return can be crimped by the adverse impact of negative roll yields that result from an upward sloping forward price curve, i.e., contango. An unsuspecting investor can end up losing money with commodity exchange traded funds even when the spot commodity price is rising.

Specific commodity exchange traded products also require investors to take the credit risk of the ETF issuing institution. Some commodity exchange traded funds require investors to deal with a K-1 at tax time.

What Does This Mean for Commodity ETF Investors

Commodity exchange traded funds are attractive investments that can provide diversification benefits. However, commodity exchange traded funds are complex investment vehicles. At a minimum, investors need to analyze the trend in spot commodity prices along with the commmodity ETF management strategy to determine the best commodity ETF.