The third quarter was a good one for investors. The S&P 500 gained 15% as stock price volatility declined, risk appetite rose, and confidence in financial markets seemingly improved – a milieu in which online stock trading companies should normally thrive.
However, earnings reports from leading online trading brokers Charles Schwab (SCHW), TD Ameritrade (AMTD), and E*Trade Financial (ETFC) portray a different story.
Are Online Stock Trading Companies, a Buy, Sell, or Hold?
Charles Schwab: Daily average revenue trades (DART) at the largest U. S. online brokerage declined 9% in the quarter causing Schwab’s trading revenue to fall over 4%. The online stock trading company also waived $78 million in fees from its money market mutual funds in the third quarter. These factors caused SCHW’s quarterly revenue to plummet 19% from the year-ago period to $1.0 billion.
TD Ameritrade: Lackluster revenue growth and rising expenses chipped away Ameritrade’s profits. AMTD’s acquisition of options-trading specialist thinkorswim helped trading activity to increase 35% and trading revenue to soar 38%. However, the online broker’s overall revenue grew just 1% to $658 million as low interest rates reduced income. This combined with higher expenses from the thinkorswim acquisition lowered AMTD’s profits by 9% from a year ago.
E*Trade Financial: E*Trade’s daily average revenue trades increased 7% from the year-ago period helping quarterly revenue to increase 52% to $575 million. However, damage from the housing debacle and credit crisis took a toll on ETFC’s bottom line. The online broker took a massive $773 million charge in connection with the $1.74 billion debt swap program. These losses compounded operating losses to push the bottom line to a negative $832 million.
The outlook for online stock trading companies is starting to improve. Third quarter GDP data point to the end of the recession. Countries like Australia and Norway have raised short-term interest rates. Although there are concerns over the strength of the economic recovery in the U. S., it is conceivable that the Federal Reserve may raise short-term interest rates in 2010. This should remove one of the negatives affecting online broker earnings. If trading volumes hold up or increase, online brokers can improve their earnings in 2010.
As for specific stocks, investors can nibble and start to build positions in AMTD and SCHW. These brokers stand a good chance of posting positive earnings comparisons starting with 2010’s first quarter. ETFC may break-even in 2010 and its shares have takeover appeal. However, given weak finances, ETFC shares are suited only for the most risk-tolerant investors.
Recent U. S. economic data and the course of the stock market are indicative of the effects of energy insecurity. Growing transportation needs coupled with declining domestic oil production have left the nation increasingly dependent on foreign oil. Any responsible energy plan must balance transportation needs with the imperative to reduce dependence on foreign oil.
Sky-rocketing Oil Prices.
Oil prices have been on a roll this year. As of August 10, crude oil prices have climbed over 45% since the start of 2004. Light sweet crude traded on the New York Mercantile Exchange recently recorded its all time high of $45.04 per barrel. And this has happened at a time when the Organization of Petroleum Exporting Countries has increased oil output.
Earlier in the year, the run up in oil prices was attributed to surging demand for petroleum products due to a strong global economy. Then it was the unrest in Venezuela and Nigeria.
Concerns on security of oil supplies have heightened more recently. Added to the pipeline disruptions in Iraq are kidnappings of foreign workers in the Middle East.
Yukos, the Russian oil company’s tax evasion dispute has taken center stage currently. With a production rate of 1.7 million barrels a day (mmbd), Yukos is Russia’s largest oil producer.
While the underlying factors behind the dramatic increase in the price of oil this year are a combination of all the above, the impact is hardly comforting.
Weakening Economy.
Higher oil prices that work like an added tax have the effect of holding down hiring, consumer spending, and corporate profits.Weakening Economy.
The July jobs report that was released by the Labor Department on August 6 was a disappointment. The U.S. economy added a mere 32,000 to the non-farm payrolls, the lowest monthly addition this year. The rate of employment growth is slowing as business confidence appears to be undermined by rising oil prices. High oil prices are also taking the bite out of consumer spending.
By some economists’ estimates, every $10 rise in the price of oil knocks 0.5% off of GDP growth and adds about the same amount to inflation. The equity markets have been fixated with the trend in oil prices and have relentlessly spiraled lower since late June. On August 6, the Dow Jones Industrial Average closed at 9,815.33, its lowest level since Nov. 28 after losing more than 300 points over the last two sessions. The technology heavy Nasdaq Composite Index is down over 11% since the start of the year.
The Root Cause: Transportation Relies on Foreign Oil.
A combination of declining domestic oil production and increasing oil consumption has left the U.S. increasingly dependent on foreign oil.
The U. S. Department of Energy’s Energy Information Administration states that domestic oil production in 2002 was 5.8 mmbd, about 36% lower than the 9.0 mmbd produced in 1985. The total use of petroleum products on the other hand has grown from 15.2 mmbd in 1985 to 19.3 mmbd in 2002.
The lion’s share of oil consumption stems from transportation needs. In 2002, the transportation sector accounted for about 68% of total petroleum use with gasoline accounting for two-thirds of the petroleum consumed in the transportation sector.
U.S. net oil imports have grown from 4.3 mmbd in 1985 to 10.4 mmbd in 2002. Net oil imports as a percent of U. S. petroleum product use has risen from 28% in 1985 to 54% in 2002.
Based on Sandia National Laboratories and U. S. DOE/EIA forecast, an additional 7.5 mmbd of oil and petroleum products will have to be imported by 2020 to bridge the gap between growing consumption and falling domestic oil production. In 2020, U.S. oil production will supply less than 30% of U.S. oil needs.
The Energy Bill: Long-Term Plan for Energy Security.
The picture the current events paint as a preview of the future is cause for concern.
On August 6, Democratic presidential nominee John Kerry outlined a $30-billion, 10-year plan to veer the U. S. towards energy independence. The plan includes tax breaks and incentives for carmakers and buyers, coal producers and alternative fuels research. President Bush responded saying Kerry’s proposals mimic much of what Bush had already proposed but is stalled in Congress.
It will not be adequate if President Bush and Senator Kerry just reignite the energy debate. To bring clarity to energy security, we need a comprehensive long-term national energy plan that will reduce our reliance on foreign oil while meeting the nation’s growing transportation needs.
Both supply and demand sides of the transportation issue will have to be addressed to make a meaningful impact in reducing the dependence on foreign oil. Steps to increase the supply of domestic transportation fuels including alternatives to oil will likely be required. So too will efforts to reduce per capita transportation fuel consumption.
Based on what has been outlined to date, neither the Bush proposal nor the Kerry plan appears to fully address the critical transportation issue. The House-Senate conferees have an opportunity to deliver a responsible energy bill to the President’s desk for his signature. If the dependence on foreign oil is not reduced, the course of the U. S. economy and the stock market may well be shaped more by decisions made in Moscow, Riyadh, and Vienna rather than being determined by the decisions made at home.
In a trend that represents a reversal from the excessive capital spending that characterized the late 1990s, many corporations have quietly been accumulating cash on their balance sheets over the past few years.
In August CFO Magazine reported that cash and marketable securities made up about 15% of total capital employed at the end of 2003, up from 11% at the end of 2001. This finding is based on REL Consultancy Group’s study of 1,000 companies spanning several industry groups.
Software companies
Rising levels of cash on a company’s balance sheet is usually a harbinger of corporate events such as initiation of or increases in dividend payments and share buybacks. For well-managed, growth-oriented companies, having additional cash can lead to a spurt in organic growth or acquisitions. The combination of a high-cash balance and an attractive valuation could make a company a takeover candidate as well. With this in mind, I set out to seek sectors and companies that stand out as “high-cash plays.”
In analyzing CFO Magazine’s Cash Management Scorecard, I focused on sectors that stand to benefit the most in increasing their return on capital employed (ROCE) by using their excess cash.
Cutting right to the chase, three sectors stand out as high-cash plays: software companies, health-care providers, and apparel retailers. REL Consultancy estimates that these three will be able to increase their ROCE by 22.3%, 6.8%, and 6.0%, respectively, by reducing their excess cash.
At the end of 2003, the cash level in the software industry was a whopping 110.3% of sales, thanks to the 41.2% increase in the cash-to-annual-sales ratio since 2001. While Microsoft (Nasdaq: MSFT) accounts for the lion’s share of the increase in cash in this sector, cash hoards at Oracle (Nasdaq: ORCL) and Siebel Systems (Nasdaq: SEBL) are nothing to sneeze at. Oracle’s cash stack is $8.6 billion tall, whereas Siebel has close to $2.1 billion in its vault.
In July, Microsoft outlined plans for using its cash and cash-generation capacity. The company put forth its $75 billion multiyear shareholder-payout program that includes dividends and share buybacks along with a $32 billion payout in a special dividend. Oracle’s pursuit of PeopleSoft appears to have hit a roadblock. What Oracle and Siebel do with their cash remains to be seen.
Health-care providers
Cash as a percentage of sales for health-care providers has bumped up by 2.7% since 2001 to reach 12.6% by the end of 2003. The more cash-rich companies here are Humana (NYSE: HUM) and PacifiCare Health Systems (NYSE: PHS). Cash levels at Humana and PacifiCare are $2.5 billion and $2.3 billion, respectively. It should, however, be noted that some of this cash is held to fulfill regulatory requirements and is, as such, not available for general corporate use.
Apparel retailers
Among apparel retailers, Gap (NYSE: GPS) and Limited Brands (NYSE: LTD) hold $4.6 billion and $1.9 billion in cash, respectively. For the most part, these two companies have contributed to the apparel retailing sector by increasing their cash-to-annual-sales ratio by 8.2% since 2001 to reach 13.8% in 2003.
Parting with cash
Balance sheets of software companies, health-care providers, and apparel retailers are ripe with cash. The impressive ability of these companies to generate operating cash flow and, to a lesser extent, divestiture activity is responsible for this cash.
In my opinion, paucity of growth opportunities is not an issue here – neither as a reason for holding additional cash, nor as a barrier to its utilization: There are bountiful opportunities for creating new software applications, offering new, cost-effective medical services, or introducing retailing concepts.
The richness in cash provides management teams in such companies the ability to pull three levers – organic growth, acquisitions, and share buybacks – to create shareholder value. However, management teams have to be savvy enough to ensure that the cash does not get bungled up in excessively risky projects or overpriced acquisitions. Seeking stuff sans sizzle is specially an issue in the software space, where product as well as technology life cycles are notoriously short. If not, the company and its cash will be foolishly parted, as in the merger of Time Warner with AOL and the acquisition of Sema by Schlumberger.
The high levels of cash in software companies, health-care providers, and apparel retailers provide investors with opportunities to seek growing dividends and EPS. For investors choosing to avoid the onerous task of evaluating management teams, no-load sector funds such as Fidelity Select Software and Computer Services and Fidelity Select Medical Delivery offer a means to capitalize on high-cash plays in software companies and health-care providers, respectively. As for apparel retailers, Fidelity Select Retailing is an acceptable alternative. Although the Fidelity Select Retailing fund does not focus exclusively on apparel retailers, the other retailing segments the fund invests in – namely broadline and specialty retailers – rank pretty high in terms of the potential to increase ROCE by paying down capital.
Sector Data in Descending Order of ROCE Impact
Data source: CFO Magazine (August 2004).
* Based on 2003 pretax operating profits.
** Calculated assuming excess cash is used to reduce the amount of capital employed.
*** Difference between adjusted ROCE and 2003 ROCE.
In part two, Sam Subramanian covers how selected companies might use excess cash and how investors canfollow cash trailsto generate investments. Guest columnistSam Subramanianis the managing principal ofAlphaProfit Investments, a Houston-based investment research firm. Sam does not own shares in any of the companies or mutual funds mentioned in this article. The Motley Fool isFools writing for Fools.
Year 2009 has been tough for many investors. Investors who panicked in March and fled from equities to cash have watched their monies earn abysmally low returns while stock prices took off. The S&P 500 is now up 64% from its 2009 bottom, making it difficult for cash-laden investors to decide if it is right to return to equities.
Investor confidence is fragile. Fears of inflation are running high. Gold recently broke through the $1,100 per ounce mark. Meanwhile, corporations continue to layoff workers and the U. S. unemployment rate stands at 10.2%, the highest since 1983.
The gross domestic product expanded at a 3.5% annualized rate in the third quarter compared to the 6.4% decline in the first. Increasing for six straight months, the Conference Board’s index of leading economic indicators (LEI) has now risen at the highest six-month rate since 1983.While the recent run in equities could be due for a pause, I believe the odds of equity prices breaking through the March 2009 lows are relatively remote for the following reasons:
Although gold has surged due a weakness in the U. S. dollar, inflation expectations have not gotten out of hand. The implied 10-year inflation rate based on Treasury yields is a palatable 2.1%.
The 4-week average of initial jobless claims has now declined to 523,750 from 657,250 in April. The number of temporary hires has also ticked up for three straight months. These data suggest that the rate of layoffs is moderating and employers are now willing to add to payrolls at least on a temporary basis.
I believe the more likely scenario is one of equity prices going sideways for sometime before the bull market gets another leg up. As such, it is good time to be in equities if one has a time horizon of three years or more.
So, how does one invest in the stock market based on this scenario?
Mutual fund investors. Dollar-cost averaging into no load, diversified mutual funds with stable management, modest expense ratios and minimum investment requirements, and strong performance is a low-maintenance way to get back on track. The Yacktman Fund (YACKX), a AlphaProfit Fund Guide pick and Fidelity Low-priced Stock (FLPSX) are examples of mutual funds worth investigating.
Sector fund and ETF investors. Investors who prefer to be somewhat more involved with their investments can target sectors and industries likely to play catch up and outperform the broad market. Laggards like health care are a good place to start the homework.
The potential impact of higher volume and lower margins from health care reform now appears be a more of 2011 rather than a 2010 issue. Fidelity Select Health Care (FSPHX) and Healthcare Select Sector SPDR (XLV) are two investment vehicles that provide broad exposure to the health care sector.
Stock investors. The 2009 bull market has favored lower quality stocks over higher quality ones. Investors who like to be actively involved with their investments can target good quality stocks trading at attractive prices.
The health care sector is rife with high-quality laggards. Shares of managed care giant UnitedHealth Group (UNH) have just managed to nudge their way above the flat-line in 2009 after the company reported a 17% upside EPS surprise.
Looking beyond health care, Darden Restaurants (DRI), the operator of Red Lobster and Olive Garden restaurant chains and aerospace & defense firm Raytheon (RTN) are two more names worth studying.
Cash-Rich Sector Plays, I discussed how software companies, health-care providers, and apparel retailers stand out as high-cash play opportunities. What a firm is likely to do with excess cash depends on the company and its situation. Some may initiate or increase dividend payments and share buybacks, while others may use the cash for organic growth or acquisitions. The combination of a high-cash balance and an attractive valuation could also make a company a takeover candidate.
In this second part, I cherry-pick some companies in retailing and health care to illustrate how investors with different objectives can hone in on cash to shop for investment ideas. I’ve chosen companies in the enviable position of having significant cash and short-term investments on their balance sheets, with the potential to handily increase their return on capital employed (ROCE) by using their excess cash. Since investors in companies with excess cash run the risk that inept management teams might waste this resource on ill-conceived, value-destroying projects, I intentionally left out companies with a checkered history of acquisitions or mergers.
Did Your Nest Egg Gain from the Coronavirus Crash?
Sick buying high & selling low? Fed up of the fees you pay? Tired researching investments? End your financial pain now. You have the opportunity to earn superior returns with low expenses, low risk, and minimal effort.
To provide insight on how specific companies in these sectors are likely to use their excess cash, I break them down into three categories:
Growth seekers: Companies that seek organic growth as well as growth through acquisitions.
Stakeholder repayers: Companies that return capital to equity as well as debt holders.
Merger candidates: Companies that are likely takeover targets.
Most of the cash available with Bed Bath & Beyond (Nasdaq: BBBY), Varian Medical Systems (NYSE: VAR), and Forest Laboratories (NYSE: FRX) is likely to be funneled to fulfill the strong growth aspirations of these companies.
Bed Bath & Beyond has a squeaky-clean balance sheet free of long-term debt. It has an enviable record of almost quadrupling its earnings per share from 1998 to 2003. The $815 million in cash, coupled with ample opportunities for growth in home goods retailing, position BBBY to nicely grow its store base in the coming years. Trading at a PEG ratio of less than 1.0, BBBY shares are an intriguing selection for investors seeking growth at a reasonable price.
Many of the positive attributes of Bed Bath & Beyond also apply to Varian Medical, the manufacturer of cancer-care systems. With relatively low long-term debt of less than $60 million, it has proven to be an earnings powerhouse after Varian Associates spun off its semiconductor equipment business and made Varian Medical the surviving entity in 1998. While organic growth has been impressive, VAR has not been shy of acquisitions. Using $18 million of its cash, Varian acquired OpTx, a supplier of oncology practice software earlier this year. Varian’s shares trade at a PEG ratio of about 1.35, and its war chest amounts to about $340 million.
With a PEG ratio less than 0.9, shares of Forest Laboratories are better suited for risk-tolerant growth investors. Cumulative earnings growth for the five-year period ending in 2003 was a mightily impressive 750%. New York State Attorney General Eliot Spitzer’s request for information concerning Forest’s off-label clinical trials has weighed heavily on Forest’s shares recently. Looking ahead, the active ingredient of Forest’s depression drugs loses patent protection next year, and competition in this space is intensifying, with Eli Lilly’s (NYSE: LLY) launch of Cymbalta on August 24. Forest management has a formidable $1.8 billion cash stack at its disposal to try to maintain the company on its growth track.
Stakeholder repayers
With cash in excess of growth opportunities, retailers Gap (NYSE: GPS) and Abercrombie & Fitch (NYSE: ANF) are returning capital to their stakeholders. But income-oriented investors will likely have to wait awhile for the dividend yield to reach enticing levels.
The management at Gap has made significant strides in paying back debt. Long-term debt has been slashed from $2.9 billion in August 2003 to $2.3 billion as of May 2004. Further debt reduction is in the offing as the company seeks to regain its investment grade credit rating. In all probability, the $1.4 billion in senior convertible notes will be called after March 2005 and the resulting dilution offset by share buybacks. Gap’s dividend, which has been stuck at 8.8 cents per year since 1996, could get bumped up subject to renegotiation of the current credit facility that restricts cash dividends to this amount. Until such time, Gap shareholders will have to remain contented with the current dividend payment. Gap shares currently yield 0.45% — better than nothing, but much lower than what Fool dividend guru Mathew Emmert looks for in his Motley Fool Income Investor stock picks. Trading at a forward P/E of about 13, though, Gap is an alluring selection for the long-term investor.
For investors seeking the safety in earnings growth driven by share buybacks, Abercrombie & Fitch looks interesting. In February 2004, Abercrombie initiated cash dividend payments, and in July 2004 it announced it would buy back 6 million shares over time. The company currently sports a 1.70% dividend yield. A combination of about $540 million in cash reserves, erratic trends in same-store sales, and subdued growth prospects are likely to make it increasingly look to share buybacks to shore up EPS growth.
Merger candidates
The merger of excess cash, industry dynamics, and attractive valuation leaves Humana (HYSE: HUM) and Sears (NYSE: S) with the possibility of being acquired.
Health-care provider Humana is in the midst of a space where consolidation activity is rampant. Recently, Oxford Healthcare was acquired by UnitedHealth (NYSE: UNH), and Anthem (NYSE: ATH) and WellPoint Health (NYSE: WLP) are seeking to merge. Humana’s cash vault of $2.5 billion is in excess of regulatory requirements. With shares trading at a forward P/E of about 10, Humana could be next in line.
Share buybacks at Sears continue unabated. The company has reduced its share base to 212 million from 320 million at the end of 2001. Despite this aggressive reduction in share count, per-share earnings have hardly budged over the past couple of years. Meanwhile, cash has swelled to $4.2 billion. Sears seeks to acquire 61 stores from Kmart (Nasdaq: KMRT) to develop its off-mall concept. Notwithstanding the retailer’s effort to shore up its earnings through this concept, Sears’ growth pipeline appears limited. Sears’ cash hoard of $20 per share coupled with the forward P/E of about 11 makes the company a takeover candidate.
For growth as well as value investors, focusing on company cash hoards and cash-generating ability is a profitable endeavor for seeking investment ideas. Investors can better meet their investment objectives by evaluating a company’s options for using cash. Bed Bath & Beyond, Varian Medical, and Forest Laboratories stand to meet the tests of growth-seeking investors. While Gap and Abercrombie & Fitch are flush with cash, income-oriented investors will have to look elsewhere (Income Investor might be a good place to start). For the value conscious, Humana and Sears could well be worth their money.
Company Cash and ROCE Data
Data source: Yahoo! Finance, CFO Magazine (August 2004).
* Based on 2003 pretax operating profits.
** Calculated assuming excess cash is used to reduce the amount of capital employed.
*** Difference between adjusted ROCE and 2003 ROCE.
Want to learn more about companies with excess cash on hand? In part one of this two-part series, Sam Subramanian names threecash-rich sectorsto keep an eye on.
Check out the meaty dividend-paying stocks that Mathew Emmert digs up each month in Income Investor. A free trial is yours for the asking.
Guest columnistSam Subramanianis the managing principal ofAlphaProfit Investments, a Houston-based investment research firm. Sam does not own shares in any of the companies or mutual funds mentioned in this article. The Motley Fool isFools writing for Fools.
Operating metrics for wireless companies are improving as pricing has firmed as pricing has firmed and customer churn has moderated. Stocks in the wireless group have been on a tear. Is it time for investors to bail out of this group?
During the go-go days of the late 90s, capital was cheap and wireless service providers invested heavily amid ever increasing projections for wireless subscribers. Then the bottom fell off. Brutal price competition and the resulting customer churn took a heavy toll on operating margins as the DJ Wireless index swooned over 90% from March 2000 to October 2002.
The industry has been getting its act together on the pricing front for some time. Customer churn rates have moderated. Capital expenditure has been reined in and operating margins have expanded. Low interest rates have enabled debt-laden companies to strengthen their balance sheets. Nextel Communications (NDQ: NXTL), for example, has been able to slash its debt by a whopping $5 billion. The improvement in the operating performance of the wireless technology companies has attracted significant investor attention. Fidelity Select Wireless (NDQ: FWRLX), a mutual fund that concentrates its investments in this sector, has doubled its net asset value since the end of 2002.The obvious question for investors: Is it time to hang up?
We review drivers from an investing perspective to articulate our thoughts on where the wireless sector is headed.
Subscriber Growth in Emerging Markets.
With wire-line connectivity in emerging markets such as China, India, and Russia being low on a per capita basis, wireless technology offers a low cost means for the populace in these counties to get connected while avoiding investments in wire-line infrastructure. With year-over-year revenues and earnings ramping at over 75%, shares of Russian wireless service providers, like Mobile Telesystems (NYSE: MBT) and Vimpel Communications (NYE: VIP) have each soared over 140% in the past 52 weeks. The number of subscribers is nowhere close to saturation yet; as such, we believe there is further room for significant growth in wireless subscribers in these countries. Looking ahead to the 2005-10 time-frame, subscriber growth rate in China is estimated to average 12% annually, a rate nearly 3 times that in mature markets. Such large increases in the subscriber base requires significant investment in wireless infrastructure and companies like Qualcomm (NDQ: QCOM) and LM Ericsson (NDQ: ERICY) stand to be continued beneficiaries of this capital spending. QCOM for example, shipped 32 million phone chips in 1Q2004, a record number, and said demand will increase in 2Q2004 quarter, forcing the company to consider adding production capacity. Shares of QCOM and ERICY have swelled over 100% and 200%, respectively in the past 52 weeks.
Revenue Enhancement Opportunities in Mature Markets.
“Although subscriber growth will eventually slow, growth opportunities from a revenue stand-point continue to be abundant as revenue per customer stands to grow from new high-speed wireless data, wireless Internet access, and wireless information services.”
Subscriber growth in mature markets such as those in the U.S. has ticked up thanks to new phone features like integrated cameras as well as regulations like telephone number portability. We view this acceleration as more of a temporary phenomenon. Longer-term, growth in number of subscribers will decline from current rates as we approach saturation levels. Meanwhile, the nation-wide roll-out of telephone number portability slated for end May will also keep wireless operators on their toes in providing quality services to minimize churn.
Although subscriber growth will eventually slow, growth opportunities from a revenue stand-point continue to be abundant as revenue per customer stands to grow from new high-speed wireless data, wireless Internet access (or Wi-Fi), and wireless information services. Wireless data services and data revenue are forecasted to grow at double digit rates in the years ahead. Looking out to 2006-08, Wi-Max, a new form of high-speed, longer reach wireless networking and Mobile-Fi, the extension of Wi-Fi to moving vehicles, are likely to gain widespread use.
Wireless service providers will have to invest in 3G wireless networking services to go after wireless data service opportunities. 3G wireless networking improves the quality of wireless service while adding a data delivery component. This augurs well not only for well-capitalized wireless service providers like Vodafone (NYSE: VOD) but also for wireless equipment providers like ERICY and Alcatel (NYSE: ALA) as 3G network deployment gains traction in 2005. Research in Motion (NDQ: RIMM), the leading player in wireless messaging, courtesy its Blackberry, is also well positioned for this opportunity.
Fickle Handset Customers.
Sales of handset units are forecasted to grow 10% in 2004 from 2003 levels. New features such as color displays, integrated cameras, short-messaging, and web access capability have driven a strong handset replacement cycle in mature markets while a growing subscriber base continues to spur handset demand in emerging markets. While the total pie has been growing, Nokia (NYSE: NOK), the global handset leader has been at the losing end of the market share game for some time as its handsets have not struck a chord with consumers. Other handset manufacturers like Motorola (NYSE: MOT), South Korea based Samsung Electronics (005930.KS), and SonyEricsson, the London based 50/50 joint venture between Sony and Ericsson, appear to be beneficiaries of NOK’s market share decline.
Value Creation through Consolidation.
The pressures from a declining long-distance business as well as economies of scale in the wireless service business make acquisition of wireless assets attractive for major telecom service providers as well as wireless service providers. Wireless represents a growth opportunity for the embattled telecommunication service providers facing the strong headwinds of a declining long distance business. Earlier this year, when AT&T Wireless (NYSE: AWE) put itself up for sale, buying interest was keen from both major telecom carriers as well as wireless service providers. Eventually Cingular, the SBC Communications-Bell South joint venture, was the winning bidder at a price tag of $1,850 per AWE customer. With Cingular leapfrogging to become the nation’s largest wireless service provider, we think there is more to come by way of consolidation.
Sprint (NYSE: FON) has recently recombined its ‘tracking stocks’ FON and PCS potentially making this company a part of consolidation plays. So too are niche wireless providers like U. S. Cellular (ASE: USM). NXTL and Verizon Communications (NYSE: VZ) may also be participants in this industry’s consolidation efforts.
In closing, we think the easy money in this sector has been made and share prices in this sector may consolidate for some time. That said, the opportunities for growth in this industry continue to remain attractive and any pull-back will likely be a buying opportunity. At this juncture, we favor wireless infrastructure provider, QCOM. Handset maker, MOT that appears to be on the mend, has added attraction as a restructuring play. Among wireless service providers, we favor NXTL for its strong-hold over construction and manufacturing businesses. Investments in wireless service providers have additional appeal for their potential to create value through consolidation. All said, while the rate of capital appreciation will likely be slower going forward, we believe there are several forces at play here which will likely enable this sector to outperform broader averages like the unmanaged Wilshire 5000 Total Market Index.
The AlphaProfit Sector Investors’ Newsletter completed 5 years of uninterrupted publication on September 30. On this occasion, we compare the performance of AlphaProfit model portfolios with that of the five largest no-load domestic mutual funds and Fidelity’s five largest domestic funds open to new investors.
Through superior sector selection, both AlphaProfit model portfolios have outperformed popular no load mutual funds and the S&P 500 index.
Portfolio, Fund or Benchmark
Ticker
Annualized Return from 9/30/03 to 9/30/08
AlphaProfit Focus Model Portfolio
12.2%
AlphaProfit Core Model Portfolio
8.2%
5 Largest No-Load Domestic Funds
Growth Fund of America, C
GFACX
6.1%
Vanguard 500 Index
VFINX
5.0%
Vanguard Total Stock Market Index
VTSMX
5.9%
American Funds Investment Company, C
AICCX
4.6%
American Funds Washington Mutual, C
WSHCX
4.8%
Fidelity’s 5 Largest Domestic Funds
Fidelity Magellan
FMAGX
2.3%
Fidelity Equity Income
FEQIX
4.5%
Fidelity U.S. Equity Index Investor Class
FUSEX
5.1%
Fidelity Value
FDVLX
7.8%
Fidelity Blue Chip Growth
FBGRX
3.1%
Average for Large Domestic Funds
4.9%
S&P 500
5.2%
Mutual fund return data from Morningstar
Since inception on September 30, 2003, AlphaProfit Focus and Core model portfolios have compounded at an average annualized rate of 12.2% and 8.2%, respectively compared to a 4.9% rate for the fund titans and 5.2% for the S&P 500 benchmark.
Morningstar is now providing Fiduciary grades on mutual funds. How are these grades determined? How can investors benefit from these grades?
Mutual funds investors use Morningstar Rating™ as a sign post of mutual fund performance. These ratings have proved to be a valuable tool for objectively comparing the performances of different mutual funds.
In 2003, New York Attorney General, Elliott Spitzer launched actions against some mutual fund companies for allowing their privileged clients to profit from improper activities such as late trading.
In the aftermath of these developments, investors realize that they need more than the historical performance based Morningstar Ratings to evaluate mutual funds. The Morningstar Ratings do not get at critical intangibles such as how seriously the mutual fund company takes its fiduciary responsibility to mutual fund investors.
To address this need, Morningstar has embarked on a system called the Fiduciary Grade. Morningstar has so far graded about 635 mutual funds, including 500 of the largest ones. Morningstar plans to provide Fiduciary Grades for a total of 2000 mutual funds over time.
The Basics of the Morningstar Fiduciary Grade System
The Morningstar Fiduciary Grade is based on the evaluation of five areas critical for mutual fund governance and operations. Morningstar generally assigns to mutual funds points ranging from 0 (Very Poor) to 2 (Excellent) in increments of 0.5 for each of these five areas.
1. Regulatory Issues: Morningstar examines if the mutual fund company has had any regulatory issues within the past three years. If so, what corrective action has the mutual fund company implemented? Unlike the other four areas, the minimum score here can be a minus 2.
2. Board Quality: Morningstar looks for a demonstrated track record of the mutual fund board protecting the mutual fund investor’s interests. Mutual funds get kudos if their independent directors invest in the mutual funds.
3. Manager Incentives: This score is based on Morningstar’s evaluation of mutual fund ownership and compensation structure. Mutual funds where the fund’s manager owns a meaningful stake in the fund score high on the fund ownership dimension. A compensation structure that rewards the mutual fund manager for long-term mutual fund performance is favored.
4. Fees: Mutual funds are rewarded for having expense ratios lower than that of their peers and for effectively reducing their expense ratios with growth in their assets.
5. Corporate Culture: Morningstar looks for tangible evidence that the mutual fund company takes its fiduciary responsibility seriously. Among the factors Morningstar considers are softer issues like whether the company closes mutual funds when they get too large and whether the company starts trendy mutual funds to garner assets.
The points scored on each of the above areas are aggregated and the Fiduciary Grade is assigned based on the total: A=9-10, B=7-8.5, C=5-6.5, D=3-4.5, F=2.5 or less.
How Investors Can Use the Morningstar Mutual Funds Fiduciary Grade
Here are some ways investors can use the Morningstar Fiduciary Grade.
“The first step for buy and hold mutual fund investors is to examine how mutual funds held in their portfolio stack up on the two dimensions, Morningstar Rating and Fiduciary Grade. The utility of the Morningstar Fiduciary Grade will be significantly enhanced if superior Fiduciary Grade either by itself or in combination with the Morningstar Rating becomes a better indicator of superior future performance.”
1. Buy and Hold Investors: The first step for buy and hold mutual fund investors is to examine how mutual funds held in their portfolio stack up on the two dimensions, Morningstar Rating and Fiduciary Grade.
Mutual funds that rank favorably on both dimensions may be retained and those that rank unfavorably on both dimensions may be replaced by ones that rank favorably.
For mutual funds that rank favorably in one dimension but not in the other, the answer is not clear-cut. Retaining a fund with strong Morningstar Rating but lower Fiduciary Grade is a matter of personal choice. Conversely, a mutual fund’s Fiduciary Grade may be satisfactory but the Morningstar Rating may be unfavorable. This may just be a case of the mutual fund manager going through a temporary bad patch. Investors have to weigh these factors along with tax consequences before deciding to sell a mutual fund.
Given the number of mutual funds available, investors seeking new mutual funds to add to their portfolio should in general have no trouble in finding mutual funds with favorable Morningstar Rating as well as Fiduciary Grade.
2. Tactical Asset Allocators: A tactical asset allocator uses an active investment strategy and typically invests in mutual funds such as sector funds. For example, AlphaProfit uses its ValuM investment process to periodically alter the mix of its mutual fund model portfolios to take advantage of specific trends (e.g. rising natural gas prices, introduction of new wireless technologies).
Since tactical asset allocators seek superior performance during their mutual fund holding period, factors such as superior long-term performance which determine Morningstar Ratings are less important to them. However, these investors typically seek to own mutual funds within a single family such as Fidelity Investments for purposes of administrative ease. As such, these investors will find the Fiduciary Grade useful in evaluating and choosing mutual fund families to implement their strategies.
Our Take on the Morningstar Fiduciary Grade System
The Fiduciary Grade system is a blend of several metrics. The grading of mutual funds on regulatory issues is backward looking rather than a prognosticator of potential future trouble. The grading system includes a quantitative dimension in mutual fund fees. Also included are qualitative dimensions such as mutual fund corporate culture, manager incentives, and board quality.
The Mutual Fund Fiduciary Grade ranking provides mutual fund investors with much needed insight on the governance and operations of mutual funds. The Morningstar Fiduciary Grade System is a good first step. We believe Morningstar will refine the Mutual Fund Fiduciary Grade system over time, just as they refined the Morningstar Ratings system.
While Morningstar Ratings do an excellent job of objectively evaluating past performance, financial markets by their very nature do not allow the investor to predict future performance based on these ratings alone. Many times, funds with Morningstar Ratings of 4- or 5-star do not live up to their expectations.
The utility of the Morningstar Fiduciary Grade will be significantly enhanced if superior Fiduciary Grade either by itself or in combination with the Morningstar Rating becomes a better indicator of superior future performance. We believe the Morningstar Fiduciary Grade has the potential to become a worthy metric of mutual fund stewardship over time.
While total and compound annual returns are useful in analyzing mutual fund returns, discerning investors will delve deeper using a variety of metrics to get a more complete picture on mutual fund performance.
On December 16, 2005 a leading financial website reports the trailing 1-year and 5-year returns of Fidelity Contrafund (Nasdaq: FCNTX), a no-load mutual fund, as 19.01% and 6.97%, respectively. While the financial website provides useful pre-tax return information, there is more to mutual fund returns.
Is the performance of Fidelity Contrafund superior or inferior? How tax-efficient was Fidelity Contrafund in delivering these returns? Are the returns of Fidelity Contrafund commensurate with the risk its fund manager took?
Discerning mutual fund investors will want answers to such questions as they evaluate mutual fund returns. Before getting into the nitty-gritty of mutual fund returns, it is good to review what the data reported in the financial website actually mean.
Mutual Fund Total Return
Fidelity Contrafund’s reported 19.01% 1-year return is this mutual fund’s total return for the December 16, 2004 to December 15, 2005 period. In practical terms, $10,000 invested in Fidelity Contrafund on December 16, 2004, is worth $11,901 on December 15, 2005. Total return includes more than the appreciation (or depreciation) of the mutual fund’s share price. It also assumes reinvestment of all dividends as well as short- and long-term capital gain distributions into the mutual fund at the price at which the distribution is made.
Mutual Fund Compound Annual Return
The reported 5-year return of 6.97% for the Fidelity Contrafund is the mutual fund’s compound annual return. (The compound annual return is also called average annual return.) Compound annual return is a calculated number that describes the rate at which an investment has grown if it grew at a steady rate.
A $10,000 investment in Fidelity Contrafund on December 16, 2000 has grown to $14,005.87 on December 15, 2005. The ending value of $14,005.87=$10,000* [(1+0.0697)^5] where 6.97% is the compound annual return. The investment in Fidelity Contrafund grew at an implied growth rate of 6.97% over the 5-year period.
While total return and compound annual return are useful mutual fund performance metrics, they do not tell how a particular mutual fund has fared versus its peers. They also do not provide information on the return actually earned by investors after accounting for taxes. Finally, they do not offer insight on how well the mutual fund manager has managed risk while achieving the returns.
Mutual Fund Relative Return
Relative return helps in comparing the performance of a mutual fund against its peers. Relative return is the difference between the total return of a mutual fund and the total return of an appropriate benchmark over the same period.
Fidelity Contrafund is a large-cap growth mutual fund that primarily invests in U. S.-based companies. It is therefore appropriate to compare Fidelity Contra’s performance with that of other large-cap growth mutual funds. It is also appropriate to benchmark Fidelity Contra against indexes like the Standard & Poor’s 500 (S&P 500) which comprises of large U. S.-based companies.
While Fidelity Contrafund has a compound annual return of 6.97% for the 5-year period ending December 15, 2005, Morningstar reports the average large-cap growth mutual fund to have an average annual loss of 9.51%. The S&P 500 index has a compound annual return of just 0.61%. Fidelity Contrafund has outperformed both benchmarks with a relative return of 16.48% over its average large-cap growth mutual fund peer and a relative return of 6.36% over the S&P 500 index.
Mutual Fund After-Tax Return
Unlike return from assets held in qualified accounts such as 401k plans or individual retirement accounts, return from assets held in non-qualified individual or joint accounts are not tax-deferred. With non-qualified accounts, after-tax return is the return realized after accounting for taxes.
“While total return and compound annual return are useful mutual fund performance metrics, they do not tell how a particular mutual fund has fared versus its peers. They also do not provide information on the return actually earned by investors after accounting for taxes. Finally, they do not offer insight on how well the mutual fund manager has managed risk while achieving the returns.”
Short-term capital gains and short-term capital gain distributions received from the mutual fund are currently taxed at the same rate as earned income. Dividends, long-term capital gain distributions, and long-term capital gains realized from the sale of mutual fund shares are currently taxed at a lower rate.
Fidelity states the compound annual return for the Fidelity Contrafund before taxes is 4.01% for the trailing 5-year period ending September 30, 2005. When all distributions are taxed at the maximum possible federal tax rate, the after-tax return drops to 3.52%. The after-tax return drops further to 3.23% after accounting for the long-term capital gain tax due on sale of this mutual fund’s shares.
Mutual Fund Risk-Adjusted Return
Some mutual funds take more risk than others. It is therefore important to evaluate mutual fund returns in the light of the amount of risk mutual fund managers take to deliver the return.
Risk-adjusted return is commonly measured using the Sharpe Ratio. It is calculated using the formula (mutual fund return – risk free return)/standard deviation of mutual fund return. The higher the Sharpe Ratio, the better the fund’s return per unit-risk.
Based on returns for the 3-year period ending November 30, 2005, Morningstar reports Fidelity Contrafund’s Sharpe Ratio as 1.74. Fidelity Contrafund’s Sharpe Ratio may be compared with those of similar mutual funds to determine how Fidelity Contra’s risk-adjusted return compares with those of its peers.
Beyond Mutual Funds
Return concepts such as relative return, after-tax return, and risk-adjusted return are useful in analyzing not only mutual funds but also separately-managed accounts, hedge funds, and investment newsletter model portfolios.
While total return and compound annual return provide useful information on mutual fund performance, they do not provide a complete picture. Metrics such as relative return and after-tax return can provide valuable insights on a mutual fund’s relative performance and tax efficiency. By looking at risk-adjusted returns, investors can assess how a mutual fund’s returns stack up when risk is factored in.
In their quest for the best no load mutual fund, some mutual fund investors tend to select mutual funds based solely on fees and expense ratios. Is this always a good way to select mutual funds?
Metrics such as price/earnings ratio and dividend yield on the S&P 500 index, a commonly used proxy for the U.S. stock market, are hardly at bargain levels. Several market experts prognosticate single digit annual returns for domestic mutual funds over the next decade.
In pursuing the selection for the best mutual fund, some mutual fund investors tend to focus exclusively on fees and expense ratios. The rationale is that by choosing mutual funds with low fees, investors can have more of their capital invested. Also, no load mutual funds with low expense ratios will pass on more of the returns they earn to their shareholders.
Is shopping for the lowest fees and expense ratios the right way to select mutual funds? Not always. The answer depends on the type of mutual fund you are evaluating, the time you can devote to evaluating and managing your mutual funds investments, and the type of cost incurred.
Investing in the Best No Load Index Mutual Funds.
If you believe markets are generally efficient and prefer to invest in an index mutual fund to achieve an index-like return, shopping for the best index mutual fund based on low fees and a low expense ratio makes perfect sense. An index mutual fund’s portfolio manager seeks to invest the fund’s assets to track an index as closely and as cost-effectively as possible. Larger index funds have an advantage since they can spread their operating costs over a larger asset base.
Some of the interesting index mutual fund options currently available include no load index mutual funds like E*Trade S&P 500 Index Fund (Nasdaq: ETSPX), Fidelity Spartan 500 Index Fund (Nasdaq: FSMKX), and Vanguard 500 Index Fund (Nasdaq: VFINX) with expense ratios of 0.09%, 0.10%, and 0.18%, respectively.
Investing in Actively Managed Mutual Funds and Strategies.
If you believe portfolio managers can add value and out-perform the index through active management, fees and expenses are just one of several important factors to consider. The portfolio manager’s ability and investing style are just as important. Therefore, seeking out the best mutual fund based on just low fees and a low expense ratio may not always be the right approach. It may just be the case of being ‘penny-wise and pound-foolish’.
Legendary investor Peter Lynch, who managed the Fidelity Magellan Fund (Nasdaq: FMAGX) from 1977 to 1990, achieved returns well in excess of the market averages even after accounting for the fund’s fees and expenses.
So too has Bill Miller who currently manages the Legg Mason Value Trust (Nasdaq: LMVTX). Even after accounting for its relatively high 1.7% expense ratio, this no load mutual fund has achieved compound annual returns of 18.6% for the 10 year period ending in 2004, well in excess of 12.0% for the Vanguard 500 Index mutual fund.
AlphaProfit, an investment research firm that specializes in sector investing, uses the no load Fidelity Select Funds to implement its investing strategy through its Core™ and Focus™ model portfolios. Although not the lowest, the expense ratio of the no load Fidelity Select Funds compares favorably with that of other sector fund offerings. AlphaProfit prefers Fidelity Selects for their comprehensive coverage of sectors and industry groups. The AlphaProfit model portfolios have significantly outperformed the market averages over time.
Ensuring Your Mutual Fund Puts Your Interest First.
Whether you prefer to index or take an active approach to managing your investments, ensuring that your mutual fund is putting your interests first is good investing practice.
“If you believe portfolio managers can add value and out-perform the index through active management, fees and expenses are just one of several important factors to consider. The portfolio manager’s ability and investing style are just as important. Therefore, seeking out the best mutual fund based on just low fees and a low expense ratio may not always be the right approach.”
Mutual funds charge different types of fees. By looking at some key factors pertaining to fees, you can get a sense of whether the mutual fund puts your interests first or merely seeks to line the mutual fund company’s pockets.
Serving the Interests of Long-Term Shareholders. Some mutual funds impose short-term trading fees to discourage frequent trading of mutual fund shares. Frequent trading disrupts efficient management of the mutual fund and increases operating expenses. A short-term trading fee can therefore actually be beneficial to long-term shareholders if the fee is rightly treated by the mutual fund company.
Fidelity Spartan Total Market Index Fund (Nasdaq: FSTMX), for example, follows the practice of returning short-term trading fees collected on shares held less than 90 days to the mutual fund itself rather than passing on the benefit to the mutual fund company. By having this short-term trading fee structure, this no load mutual fund seeks to contain its operating expenses. Such fees are therefore aligned with the interests of long-term shareholders of this mutual fund.
Passing on Savings from Scale Economies. The operating expenses incurred by a mutual fund are a combination of fixed and variable costs. As the assets of a mutual fund increase, the fixed cost gets spread over a larger asset base. Therefore, the expenses incurred to operate the mutual fund as a percentage of the fund’s assets should trend lower.
A mutual fund that places the interest of shareholders first must pass on the savings from scale economies to shareholders. The trend in a mutual fund’s expense ratio therefore serves as a metric of how seriously a fund takes its fiduciary responsibility.
Key Points.
If you are searching for the best no load index mutual fund, shopping for one with low fees and expenses makes perfect sense.
If active management of investments appeals to you, fees and expenses are just one of several important factors to consider. The ability and investing style of the portfolio manager are at least just as important as fees.
The types of fees a mutual fund charges and how the fund uses the fees provides clues as to how seriously a mutual fund takes its fiduciary responsibility. Mutual funds that impose fees to contain operating expenses and return fees to the mutual fund help protect the interests of long-term shareholders.
Mutual funds that put the shareholders’ interests first typically pass on savings from scale economies to the shareholders.
Receive Free Reports
Sign up for the FREE investment newsletter AlphaProfit Money Matters and immediately receive Two Special Reports
Five Smart Ways to Profit from Sector Funds and ETFs
Avoid Three Common Mistakes ETF Investors Make
Don’t miss timely investment tips. Stay ahead of the market with AlphaProfit MoneyMatters in your inbox
Premium Service Performance
Model Portfolio Annualized Returns
DEC. 1993 to DEC. 2025
Fidelity Agg. Growth
17.6%
Fidelity Growth
14.6%
ETF Agg. Growth
17.4%
ETF Growth
14.4%
ETF Style Rot. (since 2009)
11.3%
S&P 500
10.8%
Stock Recommendation Returns
DEC. 2013 to DEC. 2025
Win Rate
91%
Avg. Holding Period
2.6 months
Avg. Gain
13.1%
MEET
DR. SAM SUBRAMANIAN
Sam Subramanian PhD, MBA has credentials that are the envy of most investment advisers. He combines strong quantitative skills with deep financial expertise and insights on inner workings of Wall Street and corporations. His creativity has helped him win 16 U. S. patents.
Prior to founding AlphaProfit Investments, LLC, Sam worked in positions of increasing responsibility in Finance and Corporate Strategy for McKinsey & Company, Exxon Corporation, and Unocal Corporation. His work centered on Acquisitions and Divestitures, Asset Valuation, Trading, Bankruptcies, and Risk Management.
Well aware of the dismal returns produced by money managers, he was determined to take charge of his own investments. He created a low cost, low effort but high return investing system and rigorously tested it for over two decades using his own money.
This high-performance system helped Sam to quickly become financially independent. Sam still invests his money, using the now award-winning system he created. He shares the unbiased, crystal-clear recommendations and market moves with his subscribers.
 The outlook for online stock trading companies is starting to improve. Third quarter GDP data point to the end of the recession. Countries like Australia and Norway have raised short-term interest rates. Although there are concerns over the strength of the economic recovery in the U. S., it is conceivable that the Federal Reserve may raise short-term interest rates in 2010. This should remove one of the negatives affecting online broker earnings. If trading volumes hold up or increase, online brokers can improve their earnings in 2010.
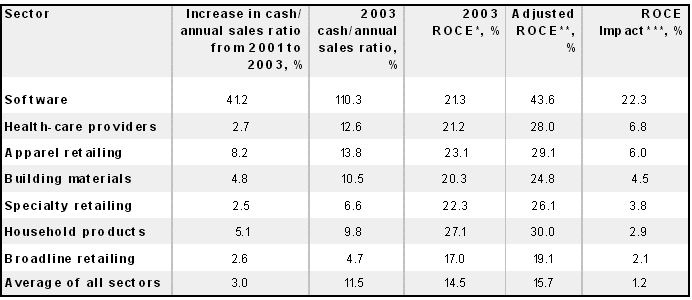
 Mutual fund investors. Dollar-cost averaging into no load, diversified mutual funds with stable management, modest expense ratios and minimum investment requirements, and strong performance is a low-maintenance way to get back on track. The
  Sick buying high & selling low? Fed up of the fees you pay? Tired researching investments? End your financial pain now. You have the opportunity to