The stock market returned to focus on earnings during the week ending May 8. Nine of the S&P 500’s top 10 winners reported earnings during the week. The one that did not, too took its cue from a peer’s report. April retail sales due on Friday, May 15 will be in focus next week.
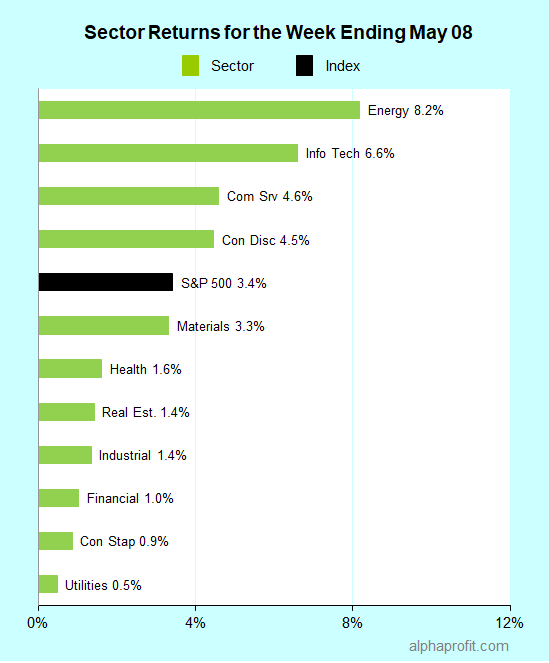
Leaders and laggards for the week ending May 8, 2020
For the week ending May 8, the S&P 500 (SPY) gained 3.4%.
All sectors gained during the week ending May 8.
Energy (XLE), information technology (XLK), and communication services (XLC) outperformed the S&P 500. Utilities (XLU) and consumer staples (XLP) lagged.
The stock market returned to focus on earnings during the week ending May 8.
Nine of the S&P 500’s top 10 winners reported earnings during the week.
Looking at this list, shares of IPG Photonics (IPGP), PayPal (PYPL), Phillips 66 (PSX), News Corp. (NWS, NWS/A), American International Group (AIG), and EOG Resources (EOG) rallied between 15% and 27% even though the companies reported lower EPS or sales from the year-ago period.
However, three standouts reported higher sales and EPS from the year-ago period even in this COVID-19 challenged milieu. They are:
* Cybersecurity company Fortinet (FTNT) +31%
Work-from-home increasing demand for Fortinet’s products that secure virtual private networks (VPNs)
Revenue +22%, EPS +33%, EPS surprise +20%
EPS guidance for next quarter: $0.64-$0.66 versus $0.59 estimate
* IT Services provider Jack Henry & Associates (JKHY) +15%
Higher fees and software usage revenue from strong demand for private cloud offerings and transaction processing
Revenue +13%, EPS +25%, EPS surprise +20%
EPS guidance for next quarter: $0.77-$0.79 versus $0.79 estimate
* Semiconductor capital equipment manufacturer KLA Corporation (KLAC) +14%
Record shipments in the Semiconductor Process Control segment with demand for products or services largely unaffected by COVID-19
Revenue +30%, EPS +37%, EPS surprise +5%
EPS guidance for next quarter: $1.81-$2.87 versus $2.36 estimate
Although KLA’s 14% gain did not place it among the top 10 winners last week, KLA’s strong earnings report spurred a rally in the shares of its larger peer Applied Materials (AMAT). Applied Materials rose 15% to make the top 10 winner list.
Looking ahead to the week of May 11
Investors will closely scrutinize reports of different states reopening their economies.
April retail sales data are in focus after they slumped by 8.7% in March. Economists forecast retail sales to decline by 11.9% in April. Retail sales data are due on May 15.
Applied Materials shares took their cue from KLA Corp.’s earnings report last week and rallied 15%. Applied Materials reports on May 14.
AlphaProfit’s Recommendations of Best Growth Stocks to Buy Now
AlphaProfit recommends attractively valued stocks with favorable near-term prospects in each Premium Service Monthly Report to help you profit from short-term investment opportunities.
To provide you with reliable winning stock recommendations, AlphaProfit evaluates stocks on both fundamental and technical factors.
Fundamental analysis ensures recommended companies are worthy of committing your precious dollars from quality, valuation, and growth perspectives.
Technical analysis provides precise buy & sell price recommendations to lock your gains.
The proof of AlphaProfit’s methodology is in the results (registration required).
On average, subscribers have netted a 13.1% gain in 2.6 months from each stock recommendation at a 91% win rate.
Risk-on trades flourished in the early part of the week. Several states announced plans to ease restrictions imposed to stem the spread of the coronavirus. Gilead Sciences’ (GILD) remdesivir offered hope of becoming an approved cure for COVID-19. This rally, however, started to unravel by the end of the week.
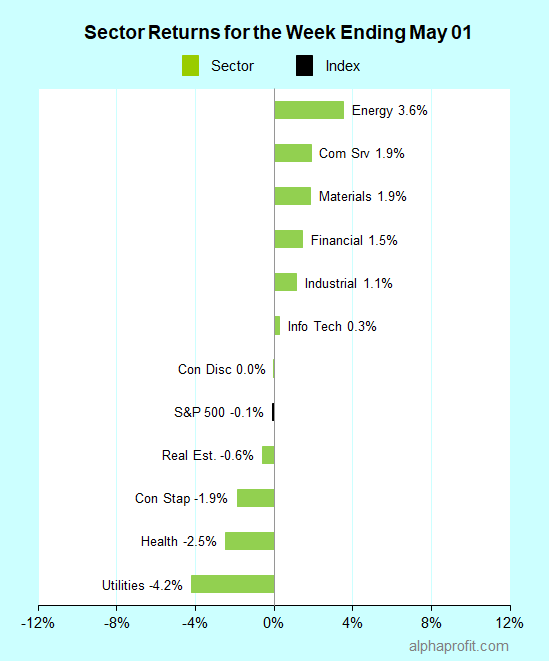
Leaders and laggards for the week ending May 1, 2020
For the week ending 5/1, the S&P 500 (SPY) lost 0.1%.
Energy (XLE), communication services (XLC), and materials (XLB) outperformed the S&P 500. Defensive sectors utilities (XLU) and health care (XLV) declined.
The S&P 500’s top winners list included:
Beaten-down cruise operators and REITs managing to hold on to gains from the ‘risk-on’ phase
Norwegian Cruise Line (NCLH) +27%, Kimco Realty (KIM) +23%, Simon Property Group (SPG) +23%, and Carnival Corp. (CCL) +17%
Companies reporting better-than-expected earnings
O-I Glass (OI) +27%, Fortune Brands Home & Security (FBHS) +18% and Principal Financial Group (PFG) +17%
Troubled buyout targets with offers in limbo
Delphi Technologies (DLPH) +20% and L Brands (LB) +16%
AlphaProfit’s Recommendations of Best Growth Stocks to Buy Now
AlphaProfit recommends attractively valued stocks with favorable near-term prospects in each Premium Service Monthly Report to help you profit from short-term investment opportunities.
To provide you with reliable winning stock recommendations, AlphaProfit evaluates stocks on both fundamental and technical factors.
Fundamental analysis ensures recommended companies are worthy of committing your precious dollars from quality, valuation, and growth perspectives.
Technical analysis provides precise buy & sell price recommendations to lock your gains.
The proof of AlphaProfit’s methodology is in the results (registration required).
On average, subscribers have netted a 13.1% gain in 2.6 months from each stock recommendation at a 91% win rate.
Fidelity money market funds are an important cog in the wheel of investment products available to you. Although such funds may appear simple investments, you need to look beyond just current yield and expense ratio to figure out the best Fidelity money market fund for your hard-earned dollars. This article helps you choose the best Fidelity money market fund for your situation.
Fidelity money market funds are important investment vehicles that provide ready access to cash and relative safety.
The above attributes enable investors to temporarily park cash in such mutual funds before putting them to work in long-term investments.
Cash parked in Fidelity money market funds usually generates higher income than bank accounts. Unlike deposits in bank accounts, deposits in these mutual funds are not federally insured.
How are investors in Fidelity Money Market funds protected?
The U. S. Securities and Exchange Commission (SEC) regulates the investments owned by Fidelity money market funds to minimize investors’ risks
Generally speaking, the SEC permits Fidelity money market funds to invest in debt securities issued by government entities or corporations that mature in 397 days or less.
The SEC also requires the money market fund’s mix of debt securities to meet specific conditions. The fund must maintain an overall weighted average maturity of 60 days or less. Additionally, it must allocate stipulated percentages of assets to specific buckets such as Weekly Liquid Assets and Daily Liquid Assets depending on the type of the fund.
The SEC regulations collectively seek to ensure the fund’s investors have ready access to the money they invest. The regulations also seek to minimize the odds of investors losing principal or interest in case interest rates change or the borrower defaults.
What are the different types of Fidelity Money Market funds?
Fidelity money market funds fall into one of three major categories based on the types of investments owned by the fund:
Fidelity money market funds come in three categories. Each category has its unique strong attribute.
Fidelity government money market funds primarily invest in debt issued by the U. S. Treasury and U. S. Government sponsored-entities like Fannie Mae and Freddie Mac.
Fidelity prime money market funds, also known as general-purpose money market funds, invest in any eligible money market investment denominated in U. S. dollars including short-term debt issued by corporations and certificates of deposit.
Fidelity municipal money market funds primarily invest in debt issued by municipalities to earn income interest that is exempt from federal income tax.
The Fidelity prime money market funds and Fidelity municipal money market funds come in two types, Retail and Institutional, with these key differences.
Retail money market mutual funds are essentially limited individual investors (also called ‘natural persons’). These funds often to seek to maintain a stable $1.00 net asset value (NAV). If the fund’s ability to convert its holdings to cash falls below required minimums because of market conditions or other factors, the funds may impose a fee when shares are sold (also called liquidity fees) or may suspend share sales temporarily (also called redemption gates).
As implied in the name, Institutional money market mutual funds are held by institutional investors. They typically have minimum investment requirements in excess of $1,000,000. These funds transact at a floating NAV that is priced to 4 decimal places, e.g. $1.0000, and will experience fluctuations from time to time. Investors in these funds too can be subject to liquidity fees and redemption gates.
Fidelity government money market funds, in contrast, are available to both retail and institutional investors. Additionally, investors in these funds are not subject to liquidity fees, redemption gates, or a floating NAV.
How to Choose the Best Fidelity Money Market Fund?
Although money market funds may appear simple investments, you need to look beyond just current yield and expense ratio to figure out the right Fidelity money market fund for your hard-earned dollars. It is useful to evaluate Fidelity money market funds on four dimensions to determine the best fit.
After-tax income: Income from different types of money market funds is treated differently for tax purposes. Dividends from government money market funds are totally or partially exempt from state income taxes while those from national municipal money market funds are exempt from federal income taxes.
Income from state-specific municipal money market funds is exempt from both federal and state income taxes. AMT tax-free money market funds seek to provide income that is sheltered from the alternative minimum tax.
You can maximize your after-tax income from a Fidelity money market fund by considering factors such as your marginal tax bracket and state of residence.
Account type: Qualified accounts such as Individual Retirement Accounts provide tax-deferred growth. Taxable money market funds are often a better choice than tax-exempt money market funds for investing monies in qualified accounts.
Risk: While the probability of money market funds breaking the $1.00 NAV mark is remote, there have been a few instances. Fidelity U. S. Treasury money market fund is the safest of the lot while Fidelity U. S. Government Reserves and Fidelity Government Money Market Fund are a close second. Money market funds investing in commercial paper or debt issued by municipalities tend to carry a bit more risk.
Fund features: From applicability and usage perspectives, minimum amounts for opening an account, maintaining the account, and writing checks need to be considered.
List of Fidelity Prime Money Market Funds
Retail investors can choose from the following Fidelity prime money market funds. Among them Fidelity Prime Money Market Fund (SPRXX) is popular and has no minimum investment requirement.
Fidelity Money Market Funds
Ticker
Minimum Investment
Net Expense Ratio*
7-Day Yield*
Fidelity Money Market Fund
SPRXX
$0
0.42%
1.49%
Fidelity Money Market Fund – Premium Class
FZDXX
$100,000
0.30%
1.61%
Fidelity Money Market – Money Market Portfolio – Class I
FMPXX
$1,000,000
0.18%
1.73%
Fidelity Money Market – Money Market Portfolio – Institutional Class
FNSXX
$9,999,999.99
0.14%
1.77%
*Net expense ratio and 7-day yield as of December 14, 2019
Additionally, the following Fidelity Prime Money Market funds are available to institutional investors: Fidelity Money Market Prime Money Market Portfolio – CL I (FIDXX), Fidelity Money Market Prime Reserves Portfolio – Class I (FDPXX), Fidelity Money Market Prime Money Market Portfolio – Institutional CL (FIPXX), and Fidelity Money Market Prime Reserves Portfolio – Institutional Class (FHPXX).
List of Fidelity Government Money Market Funds
The following Fidelity government money market funds are available to retail as well as institutional investors. Among them Fidelity Government Money Market Fund (SPAXX) is popular and has no minimum investment requirement.
Fidelity Money Market Funds
Ticker
Minimum Investment
Net Expense Ratio*
7-Day Yield*
Fidelity Government Cash Reserves
FDRXX
$0
0.38%
1.34%
Fidelity Government Money Market Fund
SPAXX
$0
0.42%
1.27%
Fidelity Treasury Money Market Fund
FZFXX
$0
0.42%
1.27%
Fidelity Treasury Only Money Market Fund
FDLXX
$0
0.42%
1.28%
Fidelity Government Money Market Fund – Premium Class
FZCXX
$100,000
0.32%
1.37%
Fidelity Money Market Government Portfolio – Class I
FIGXX
$1,000,000
0.18%
1.51%
Fidelity Money Market Treasury Only – Class I
FSIXX
$1,000,000
0.18%
1.49%
Fidelity Money Market Treasury Portfolio – Class I
FISXX
$1,000,000
0.18%
1.51%
Fidelity Money Market Government Portfolio – Institutional Class
FRGXX
$9,999,999.99
0.14%
1.55%
Fidelity Money Market Treasury Only – Institutional Class
FRSXX
$9,999,999.99
0.14%
1.53%
Fidelity Money Market Treasury Portfolio – Institutional Class
FRBXX
$9,999,999.99
0.14%
1.55%
*Net expense ratio and 7-day yield as of December 14, 2019
The Fidelity Flex Government Money Market Fund (FLGXX) is closed to new investors.
List of Fidelity Municipal Money Market Funds
The following Fidelity municipal money market funds are available to retail investors. Among them Fidelity Municipal Money Market Fund (FTEXX) is popular and has no minimum investment requirement.
Fidelity Money Market Funds
Ticker
Minimum Investment
Net Expense Ratio*
7-Day Yield*
Fidelity Arizona Municipal Money Market Fund
FSAXX
$0
0.50%
0.66%
Fidelity California AMT Tax-Free Money Market Fund
FSPXX
$25,000
0.30%
0.73%
Fidelity California AMT Tax-Free Money Market Fund – Institutional Class
FSBXX
$1,000,000
0.20%
0.82%
Fidelity California Municipal Money Market Fund
FCFXX
$0
0.50%
0.64%
Fidelity Connecticut Municipal Money Market Fund
FCMXX
$0
0.49%
0.69%
Fidelity Investments Money Market Tax Exempt – Class I
FTCXX
$1,000,000
0.18%
0.99%
Fidelity Massachusetts AMT Tax-Free Money Market Fund
FMSXX
$25,000
0.30%
0.86%
Fidelity Massachusetts AMT Tax-Free Money Market Fund – Institutional Class
FMAXX
$1,000,000
0.20%
0.96%
Fidelity Massachusetts Municipal Money Market Fund
FDMXX
$0
0.49%
0.71%
Fidelity Michigan Municipal Money Market Fund
FMIXX
$0
0.55%
0.60%
Fidelity Municipal Money Market Fund
FTEXX
$0
0.42%
0.81%
Fidelity New Jersey AMT Tax-Free Money Market Fund
FSJXX
$25,000
0.30%
0.80%
Fidelity New Jersey AMT Tax-Free Money Market Fund – Institutional Class
FSKXX
$1,000,000
0.20%
0.90%
Fidelity New Jersey Municipal Money Market Fund
FNJXX
$0
0.51%
0.70%
Fidelity New York AMT Tax-Free Money Market Fund
FSNXX
$25,000
0.30%
0.84%
Fidelity New York AMT Tax-Free Money Market Fund – Institutional Class
FNKXX
$1,000,000
0.20%
0.94%
Fidelity New York Municipal Money Market Fund
FNYXX
$0
0.49%
0.67%
Fidelity Ohio Municipal Money Market Fund
FOMXX
$0
0.53%
0.71%
Fidelity Pennsylvania Municipal Money Market Fund
FPTXX
$0
0.50%
0.65%
Fidelity Tax-Exempt Money Market Fund
FMOXX
$0
0.45%
0.72%
Fidelity Tax-Exempt Money Market Fund – Premium Class
FZEXX
$100,000
0.33%
0.84%
*Net expense ratio and 7-day yield as of December 14, 2019
The bottom line on Fidelity Money Market Funds
Fidelity money market funds are useful investment vehicles that often provide higher income than bank accounts. Since they provide ready access to cash, investors can use them to hold money that may be needed at a short notice. Investors with a low tolerance for volatility are likely to appreciate the stability they provide. Investors with long investment time horizons can also use Fidelity money market funds to diversify and stabilize their portfolios. Investors should consider after-tax income, account type, risk, and fund features to determine the best Fidelity money market fund for their particular situation.
Fidelity Select Semiconductors Portfolio FSELX is up 49% this year. It has returned 24% and 21% annualized, respectively over the past 3 year and 5 year periods. What is driving semiconductor stocks? How is the Fidelity Select Semiconductors fund positioned? What is the outlook for FSELX? Is FSELX a buy, sell or hold?
The semiconductor industry is cyclical.
Semiconductor chip makers have trouble keeping up with demand, when end markets are booming.
However, when the supply of semiconductor chips exceeds demand, chip prices fall.
The demand for semiconductor chips has been in decline for some time.
Data from the Semiconductor Industry Association show worldwide monthly sales of semiconductor chips peaked at $42 billion in October 2018.
The decline in sales appears to have stopped after sales fell to $32 billion in April 2019.
Worldwide semiconductor sales have ranged between $32 billion and $34 billion per month since April.
How is the $3.3 billion Fidelity Select Semiconductors Portfolio FSELX faring in this milieu and positioned for the future?
Fidelity Select Semiconductors Portfolio has posted impressive historical returns and outperformed the S&P 500.
Fidelity Select Semiconductors Portfolio FSELX has outperformed the S&P 500 by a wide margin over the year-to-date, 1 year, 3 year, and 5 year periods.
As of November 1, 2019, the semiconductor fund has delivered a compound annual return of 24% and 21% for the 3-year and 5-year periods, respectively.
The ride has however been volatile.
Fidelity Select Semiconductors Portfolio followed the steep decline in semiconductor chipmaker shares in the fourth quarter of 2018 and lost 17%.
The semiconductor mutual fund has recouped all these losses in 2019 and tacked on some gains.
As of November 1, the Fidelity semiconductor fund is up 49% for the year.
Fidelity Select Semiconductors Portfolio FSELX has rapidly gained in price. The ride has been marked with a fair degree of volatility.
Semiconductor shares have bucked the year-over-year decline on global semiconductor sales in 2019 and rallied on the premise that worldwide semiconductor sales are bottoming and poised to grow again.
U. S.-China trade negotiations have also contributed to volatility in Fidelity Select Semiconductors Portfolio.
The semiconductor fund lost 18% in May alone when talks between the U. S. and China stalled.
In recent weeks, semiconductor company shares have risen on optimism over the U. S. and China agreeing to the first phase of a trade deal.
This has helped the Fidelity Select Semiconductors fund to recently set a new all-time high.
Fidelity Select Semiconductors fund divides its assets mainly between semiconductor chipmakers and semiconductor capital equipment manufacturers.
The top 10 holdings of Fidelity Select Semiconductors fund FSELX include semiconductor chipmakers and semiconductor capital equipment makers.
As of September 30, 2019, Fidelity Select Semiconductors Portfolio held broadline semiconductor chipmakers Intel and Broadcom, communication chipmakers Qualcomm and Marvell Technology Group, and memory chipmaker Micron Technologies among its top five holdings. Lam Research is the only semiconductor capital equipment manufacturer to figure among the fund’s top 10 holdings.
The Fidelity semiconductor fund had invested 76% of its assets in semiconductor chipmakers. Nearly 10% of the fund’s assets were invested in semiconductor capital equipment manufacturers.
Fidelity Select Semiconductors Fund has an expense ratio of 0.73%. This compares favorably with the limited assortment of semiconductor-industry focused mutual funds available. Rydex Electronics Fund and the leveraged Semiconductor UltraSector ProFund both have an expense ratio nearly twice as much.
Fidelity Select Semiconductor fund’s expense ratio is also reasonably competitive with semiconductor-industry focused exchange-traded funds. The expense ratio for such ETFs ranges between 0.35% and 0.60%.
What is ahead for Fidelity Select Semiconductors Portfolio?
Semiconductors are the enabler of products used in communication, entertainment, computation, and data storage & analysis.
The information technology revolution that drives demand for semiconductors still has a long way to go.
As the manager of Fidelity Select Semiconductors fund, Steve Barwikowski explains, “The combination of pervasive data, powerful new computing architecture, and software frameworks and analytics tools has supported a virtuous cycle for the continued growth of cloud computing and, in turn, of semiconductors. This demand will soon be augmented, as 5G – the next generation of wireless network infrastructure – becomes a reality, again driving an increasingly connected world, facilitated by semiconductors.”
The next generation of wireless network technology or 5G should improve the capabilities of emerging technologies including cloud computing, artificial intelligence, the Internet of Things, and virtual reality.
Semiconductor companies and Fidelity Select Semiconductors Portfolio, in turn, should benefit as 5G wireless networking in combination with artificial intelligence, cloud computing, the Internet of Things, and virtual reality push demand for semiconductor chips.
Supporting this thesis, industry experts at PwC expect global semiconductor industry sales to rise from $480 billion in 2018 and approach $575 billion in 2023.
Is the Fidelity Select Semiconductors Fund a Buy, Sell or Hold?
Investors who own the Fidelity Select Semiconductors fund can continue to hold them. The FSELX fund is also a worthwhile idea for short-term traders to consider.
Long-term investors looking for targeted semiconductor industry exposure are likely to be better off waiting for Fidelity Select Semiconductors fund to pull back from its all-time high and create a buying opportunity.
iShares PHLX Semiconductor ETF (SOXX) is up 44% this year. During the past 3-year and 5-year periods, it has returned 27% and 24%, respectively on an annualized basis. How is iShares PHLX Semiconductor ETF positioned for the future? What is the outlook for the SOXX ETF? Is SOXX a buy, sell or hold?
The semiconductor industry is highly cyclical.
When end markets are booming, semiconductor chip makers have trouble keeping up with demand.
However, chip prices fall if the supply of semiconductor chips exceeds demand.
The demand for semiconductor chips has been declining for some time.
Data from the Semiconductor Industry Association show monthly sales of semiconductor chips worldwide peaked in October 2018 at $42 billion.
Sales appear to have stabilized after falling to $32 billion in April 2019.
Since then, global semiconductor sales have ranged between $32 billion and $34 billion per month.
How is the $2.0 billion iShares PHLX Semiconductor ETF faring in this milieu and positioned for the future?
iShares PHLX Semiconductor ETF Performance
iShares PHLX Semiconductor ETF has posted impressive historical returns and outperformed the S&P 500.
The SOXX ETF has outperformed the S&P 500 by a wide margin over the year-to-date, 1 year, 3 year, and 5 year periods.
As of October 25, 2019, the ETF has delivered a compound annual return of 27% and 24% for the 3-year and 5-year periods, respectively.
However, the ride has been bumpy.
The SOXX ETF followed the steep decline in semiconductor chipmaker shares in the fourth quarter of 2018 and lost 14%.
The ETF has recouped all these losses in 2019 and tacked on some gains.
iShares PHLX Semiconductor ETF has rapidly gained in price. The ride has been marked with a fair amount of volatility.
As of October 25, the SOXX ETF is up 44% for the year.
Semiconductor shares have bucked the year-over-year decline on worldwide semiconductor sales in 2019. They have rallied on the premise that semiconductor sales are bottoming and set to grow again.
Trade negotiations between the U. S. and China have also contributed to the volatility of the SOXX ETF.
In May alone, the ETF lost 17% when U. S.-China talks stalled.
Semiconductor shares have risen in recent weeks on optimism over the U. S. and China agreeing to the first phase of a trade deal.
This has helped the SOXX ETF recently to rise to a new all-time high.
iShares PHLX Semiconductor ETF divides its assets mainly between semiconductor chipmakers and semiconductor capital equipment manufacturers.
The top 10 holdings of the SOXX ETF include semiconductor chipmakers and semiconductor capital equipment makers.
As of October 24, 2019, the SOXX ETF had invested 79% of its assets in semiconductor chipmakers. The remaining 21% were invested in semiconductor capital equipment manufacturers.
Its top five holdings are specialty chipmaker NVIDIA, broad-line semiconductor chip makers Intel, Broadcom, and Texas Instruments, and communication chipmaker Qualcomm. Semiconductor capital equipment manufacturers Lam Research, Applied Materials, and KLA Corporation are included among its top 10 holdings.
iShares PHLX Semiconductor ETF carries an expense ratio of 0.46%. This is just around the mid-point of competing semiconductor ETFs. The expense ratio for such ETFs ranges between 0.35% and 0.60%.
SPDR S&P Semiconductor (XSD) and VanEck Vectors Semiconductor ETF (SMH) carry a 0.35% expense ratio while Invesco Dynamic Semiconductors ETF (PSI) and First Trust Nasdaq Semiconductor ETF (FTXL) charge nearly 0.6% each.
The information technology revolution that is driving demand for semiconductor chips still has a long way to go. The next generation of wireless network infrastructure or 5G is expected to enhance the capabilities of emerging technologies such as cloud computing, artificial intelligence, the Internet of Things, and virtual reality.
Semiconductor chips play a critical role in enabling users of communication, entertainment, computation, and data storage products and analysis tools to experience the benefits of such emerging technologies.
Semiconductor companies and iShares PHLX Semiconductor ETF, in turn, stand to benefit as 5G wireless networking along with cloud computing, artificial intelligence, Internet of Things, and virtual reality drive demand for semiconductor chips.
Supporting this thesis, industry experts at PwC expect global semiconductor industry sales to recover in 2020 after a relatively weak 2019. They expect global sales to approach the $575 billion mark in 2023 from $480 billion in 2018.
Is the SOXX ETF a Buy, Sell or Hold?
Investors who own iShares PHLX Semiconductor ETF can continue to hold them. The SOXX ETF is also a worthwhile idea for short-term traders to consider.
Long-term investors looking for targeted semiconductor industry exposure are likely to be better off waiting for iShares PHLX Semiconductor ETF to pull-back from its all-time high and create a buying opportunity.
The Communication Services Select Sector SPDR ETF with ticker symbol XLC is in the works. State Street Global Advisors plans to launch this 11th Select Sector SPDR ETF when a new Communication Services sector is created in September. Read this article for insights into the nuts & bolts of the Communication Services Select Sector SPDR ETF and what this change means for other Select Sector SPDR ETFs.
In September, the licensor of the S&P 500 Index intends to reclassify several companies included in this popular U. S. stock market benchmark.
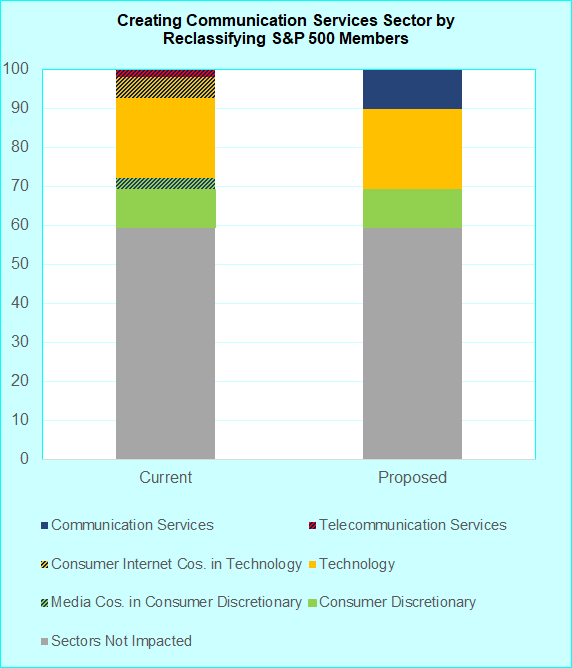
The current Telecommunication Services sector will broaden to include companies from the Consumer Discretionary and Technology sectors and rename itself as Communication Services.
The new Communication Services sector intends to capture modern methods of communication. To accomplish this objective, media, entertainment, and consumer Internet stocks from the current Consumer Discretionary and Technology sectors will be brought into Communication Services. The current constituents of the Telecommunication Services sector will also be a part of the new Communication Services sector.
The new Communication Services sector will be formed by including all companies currently in the Telecommunication Services sector, all media companies currently in the Consumer Discretionary sector, and selected consumer Internet companies currently in the Technology sector.
The new Communication Services sector will be formed by including all companies currently in the Telecommunication Services sector, all media companies currently in the Consumer Discretionary sector, and selected consumer Internet companies currently in the Technology sector.
The new Communication Services sector will account for 10% of the S&P 500 Index’s market capitalization compared to the 2% weight of the current Telecommunication Services sector.
Communication Services Select Sector SPDR ETF in the Works
State Street Global Advisors currently provides 10 ETFs under the Select Sector ETF brand. These ETFs mimic the performance of the underlying sector indexes.
For example, the Consumer Discretionary Select Sector SPDR ETF (XLY) seeks to mimic the performance of Consumer Discretionary sector index. This ETF holds all Consumer Discretionary companies in the S&P 500 benchmark that form the Consumer Discretionary sector index.
Under the proposed reclassification, the Consumer Discretionary Select Sector SPDR ETF and Technology Select Sector SPDR ETF (XLK) will eliminate holdings that move to the new Communication Services sector and reinvest the proceeds in new and continuing holdings.
State Street Global Advisors has filed for an ETF targeting the new Communication Services sector. When approved, this new ETF will become the 11th member of the SPDR Select Sector ETF suite. Named Communication Services Select Sector SPDR ETF, this entity will trade under ticker symbol XLC.
Although the gross expense ratio for the Communication Services Select Sector SPDR ETF has not been announced, it is likely to be the same as the other Select Sector SPDR ETFs at 0.13%.
Communication Services Select Sector SPDR ETF Holdings
The proposed Communications Services sector will be broader and economically more sensitive than the current Telecommunication Services sector.
Facebook (FB), Alphabet (GOOG, GOOGL), and Activision Blizzard (ATVI) are slated to leave the Technology sector and enter the Communication Services sector. Media titans Comcast (CMCSK), Disney (DIS), Netflix (NFLX), and Time Warner (TWX) are expected to move out of Consumer Discretionary and make the Communication Services sector their new home.
Current Telecommunication Services heavyweights AT&T (T) and Verizon (VZ) are expected to round out the top 10 companies in the Communication Services sector.
Here is a snapshot of the top 10 holdings of the Communication Services Select Sector SPDR ETF and their weightings based on market capitalizations as of May 11:
Facebook: 19%
Alphabet Class C: 14%
Alphabet Class A: 14%
AT&T: 8%
Verizon: 8%
Disney: 7%
Comcast: 6%
Netflix: 6%
Time Warner: 3%
Activision Blizzard: 2%
Total weight of top 10 holding rounds to 89%.
Communication Services Select Sector SPDR ETF Characteristics
The current Telecommunication Services sector is commonly seen as a domestically-oriented value play or bond-proxy. Only 3% of this sector’s sales originate outside the U. S. The sales and profits of Telecommunication Services companies have usually grown at rates below those of the S&P 500 index. All these companies fit the value investing style box. Several Telecommunication Services stocks pay relatively high dividends making their performance interest rate-sensitive.
The inclusion of companies from the current Consumer Discretionary and Technology sectors changes the characteristics of the new Communication Services sector quite markedly to a global growth play. Nearly 32% of Communication Services’ sales will originate overseas. With historical and forecasted revenue & profit growth exceeding those of the S&P 500 index, nearly 57% of the companies in Communication Services fit the growth investing style box.
Several companies in the Communication Services sector prefer to retain capital to fund their growth and do not pay much by way of dividends. As such, the dividend yield of the Communication Services sector is likely to be only one-third the dividend yield of the Telecommunication Services sector.
Impact of Communication Services Select Sector SPDR ETF on other Select Sector SPDR ETF
After high-growth names Facebook and Alphabet depart, the Technology sector and the Technology Select Sector SPDR ETF will be spearheaded by Apple (AAPL), Microsoft (MSFT), and Intel (INTC). At current market capitalizations, these three companies account for 41% of the proposed Technology sector.
In general, Apple, Microsoft, and Intel have lower forecasted earnings growth, lower forward P/E ratios, and higher dividend yield compared to Facebook and Google leaving the Technology sector. The Technology Select Sector SPDR ETF’s allocation to growth stocks will decline from about 60% to 50% after the formation of the Communication Services sector.
Following the departure of media companies, retailers led by Amazon (AMZN) would become the primary constituent of the Consumer Discretionary sector and the Consumer Discretionary Select SPDR ETF. At its current market capitalization, Amazon accounts for 28% of the proposed Consumer Discretionary sector. The Consumer Discretionary Select SPDR ETF’s allocation to growth stocks will rise from about 50% to 60% after the S&P 500 members are reclassified.
Earnings reports are an important factor affecting stock prices. The S&P 500 quarterly earnings parade starts in a few weeks. How is the 2nd quarter earnings outlook shaping up for different sectors and stocks?
The S&P 500 companies are set to report their second-quarter earnings reports in a few weeks.
During the first quarter, S&P 500 quarterly earnings grew 14.0% from the year-ago period. This exceeded analysts’ 9.0% earnings growth forecast at the end of the quarter on March 31.
Following a strong first quarter earnings reporting season, expectations for second-quarter earnings are relatively upbeat.
So, how are expectations shaping for 2nd quarter earnings?
S&P 500 quarterly earnings: 2nd quarter outlook in aggregate
FactSet data show analysts expect S&P 500 company earnings to grow 6.5% in the second quarter.
As in prior quarters, analysts have trimmed growth forecasts since the start of the second quarter.
They have cut earnings growth forecasts by 2.2% from 8.7% they expected on March 31.
This reduction in expected earnings is lower than the average reduction of 4.3% seen over the past five years.
S&P 500 quarterly earnings: 2nd quarter outlook for sectors and stocks
Analysts expect year-over-year growth in second quarter earnings in nine of the 11 sectors. Energy, information technology, and financial sectors are forecasted to lead the way.
Analysts expect earnings to shrink in consumer discretionary and utility sectors.
S&P 500 quarterly earnings are forecasted to rise 6.5% in the second quarter with energy sector earnings contributing the most to growth.
Analysts’ expect the energy sector’s earnings to grow an abnormally large 401.3%. This is due to the low profits recorded in the 2nd quarter of 2016.
Low oil prices limited aggregate profits in the energy sector to just $1.9 billion in the 2nd quarter of 2016. Energy company profits are forecasted to increase to $9.6 billion in this year’s second quarter.
Analysts expect sector heavyweights ExxonMobil (XOM), Chevron (CVX), and ConocoPhillips (COP) to record triple digit growth in second quarter earnings.
The information technology sector is expected to contribute to S&P 500 company earnings growth. Here, semiconductor companies are forecasted to increase their EPS at a rapid rate.
Micron Technology (MU) is forecasted to earn $1.50 a share, reversing last year’s loss of 8 cents a share. Analysts expect NVIDIA (NVDA) and Applied Materials (AMAT) to grow their second quarter EPS over 70% from the year-ago period.
Analysts have raised their earnings estimates in the financial sector after the Federal Reserve hiked benchmark interest rates in March and June this year. Insurers are forecasted to lead growth here. American International Group (AIG), Prudential Financial (PRU), and Allstate (ALL) are all expected to grow EPS by over 20%.
Risk to S&P 500 quarterly earnings
The energy sector accounts for nearly 45% of the growth expected in S&P 500 quarterly earnings in the second quarter. In other words, the S&P 500’s expected earnings growth rate would drop to 3.6% from 6.5%, if the energy sector is excluded.
Likewise, the energy sector is expected to contribute nearly 30% of the growth expected in S&P 500 quarterly earnings for all of 2017.
The energy sector’s earnings depend on the price of oil. They change by nearly $1 billion for every $1 change in the price of oil.
This relatively large dependence of S&P 500 quarterly earnings growth on the energy sector’s earnings and the price of oil poses some risk.
The price of oil prices has averaged higher in the second quarter of 2017 compared to its average in the second quarter of 2016. However, oil prices have off-late fallen more than 10% below the current quarter’s average due to oversupply.
Meanwhile, analysts are optimistic on the energy sector’s earnings in the second half of 2017. They expect oil prices in the second half of 2017 to exceed the second quarter’s average and help the energy sector’s earnings to exceed its second quarter tally.
If the price of oil, however, does not rebound relatively soon, analysts would be forced to reduce their energy sector earnings forecasts. This would effectively lower S&P 500 quarterly earnings growth expectations for the second half of 2017.
The February Update of the AlphaProfit Fund Investors’ Guide is now available in the Subscriber Login area. This document describes the domestic, foreign, and specialty funds included in the AlphaProfit No-Load, No-Transaction-Fee (NL-NTF) Growth Model Portfolio. Weightings for the individual funds are also provided. View February Update
The next Update of the AlphaProfit Fund Investors’ Guide will be published by Noon Central Time on Saturday, March 19.
Sector funds are mutual funds that focus their equity investments within a specific sector or industry of the economy.
Several investment companies such as Fidelity Investments, ICON Funds, ProFunds, Rydex Investments, and Vanguard Group offer sector- and industry-specific mutual funds.
Some sector funds cover broad sectors, such as information technology or health care. Fidelity Select Technology (Nasdaq: FSPTX) is an example of a sector fund. Other funds focus their investments on an industry group within a sector. Fidelity Select Computers (Nasdaq: FDCPX) for example is an industry group fund.
Some sector funds use margin or leverage to magnify their reward potential. Inverse sector funds invest in financial instruments such as swap agreements that enable fund investors to profit from share price declines.
Buying and Selling Sector Funds
Many sector funds are no load funds, i.e., mutual funds offered without a sales charge. To discourage short-term trading and to protect the interests of long-term shareholders, some mutual fund companies charge a short-term redemption fee if the investor holds sector fund shares for less than a specified minimum period.
Several sector funds are also available through brokerage firms such as Fidelity Brokerage Services, Charles Schwab, or E*Trade. These firms allow investors to buy or sell sector funds without incurring a transaction fee if the fund shares are held in excess of a specified minimum period.
Rewards of Investing in Sector Funds
Since sector funds focus their investments on a specific sector, they provide investors opportunities to benefit from causal factors affecting specific sectors at a given point.
Examples of such causal factors include:
Introduction of new products or technologies
Shifts in consumer demand
Changes in government regulations or policies
Transformation of industry structure
When such causal factors work in their favor, sector funds generally help investors earn higher returns than diversified mutual funds. The narrower focus of industry group funds enables them to amplify this benefit even more.
Risks of Investing in Sector Funds
Sector funds vary widely in volatility depending on the diversity and volatility of businesses as well as correlation between stock price movements of companies included in the fund. Sector funds in general tend to be less volatile than industry group funds.
While sector funds may appear to be volatile when evaluated on a stand-alone basis, their impact on portfolio volatility can be quite different. Sectors like energy, for example, often move with little correlation to the overall stock market. Exposure to such sectors can therefore help dampen portfolio volatility.
Using Sector Funds
Prudent investors use sector funds in ways that leverage their return potential while managing portfolio volatility. Sector funds can be used to:
Construct diversified portfolios: A diversified portfolio is constructed from sectors and industry groups with higher expected returns, offering investors the potential to outperform the market averages.
Enhance returns of diversified portfolios: By investing a portion of assets in high-growth sectors like technology or health care or by tactically rotating such assets among sectors with high-return potential, investors can boost the returns of their overall portfolio.
Stabilize diversified portfolios: Investors can reduce portfolio volatility by including sector or industry group funds with low volatility or low correlation to overall stock market.
In addition to the above uses, a higher risk tactic is to trade sector funds for short-term profits by taking advantage of opportunities market volatility may create from time-to-time.
AlphaProfit Newsletter and Sector Fund Recommendations
AlphaProfit Sector Investors’ Newsletter is the premier resource for sector investors. The Newsletter features sectors and industry groups with high-return potential.
It also offers sector funds-based model portfolios for aggressive growth and long-term capital appreciation. Risk ratings and recommendations on profitable short-term trading opportunities are highlighted.
The Newsletter and its model portfolios have frequently been ranked #1 by Hulbert Financial Digest.
The AlphaProfit no-load, no-transaction fee growth model portfolio is up 522% since the start of 2009 compared to the 444% gain for its benchmark. The model portfolio will be reconstituted with new recommendations on Saturday, November 19. Learn more about AlphaProfit's Free and Premium Service investment newsletters.
Receive Free Reports
Sign up for the FREE investment newsletter AlphaProfit Money Matters and immediately receive Two Special Reports
Five Smart Ways to Profit from Sector Funds and ETFs
Avoid Three Common Mistakes ETF Investors Make
Don’t miss timely investment tips. Stay ahead of the market with AlphaProfit MoneyMatters in your inbox
Premium Service Performance
Model Portfolio Annualized Returns
DEC. 1993 to DEC. 2025
Fidelity Agg. Growth
17.6%
Fidelity Growth
14.6%
ETF Agg. Growth
17.4%
ETF Growth
14.4%
ETF Style Rot. (since 2009)
11.3%
S&P 500
10.8%
Stock Recommendation Returns
DEC. 2013 to DEC. 2025
Win Rate
91%
Avg. Holding Period
2.6 months
Avg. Gain
13.1%
MEET
DR. SAM SUBRAMANIAN
Sam Subramanian PhD, MBA has credentials that are the envy of most investment advisers. He combines strong quantitative skills with deep financial expertise and insights on inner workings of Wall Street and corporations. His creativity has helped him win 16 U. S. patents.
Prior to founding AlphaProfit Investments, LLC, Sam worked in positions of increasing responsibility in Finance and Corporate Strategy for McKinsey & Company, Exxon Corporation, and Unocal Corporation. His work centered on Acquisitions and Divestitures, Asset Valuation, Trading, Bankruptcies, and Risk Management.
Well aware of the dismal returns produced by money managers, he was determined to take charge of his own investments. He created a low cost, low effort but high return investing system and rigorously tested it for over two decades using his own money.
This high-performance system helped Sam to quickly become financially independent. Sam still invests his money, using the now award-winning system he created. He shares the unbiased, crystal-clear recommendations and market moves with his subscribers.


 The AlphaProfit no-load, no-transaction fee growth model portfolio is up 522% since the start of 2009 compared to the 444% gain for its benchmark. The model portfolio will be reconstituted with new recommendations on Saturday, November 19.